Fig. 2
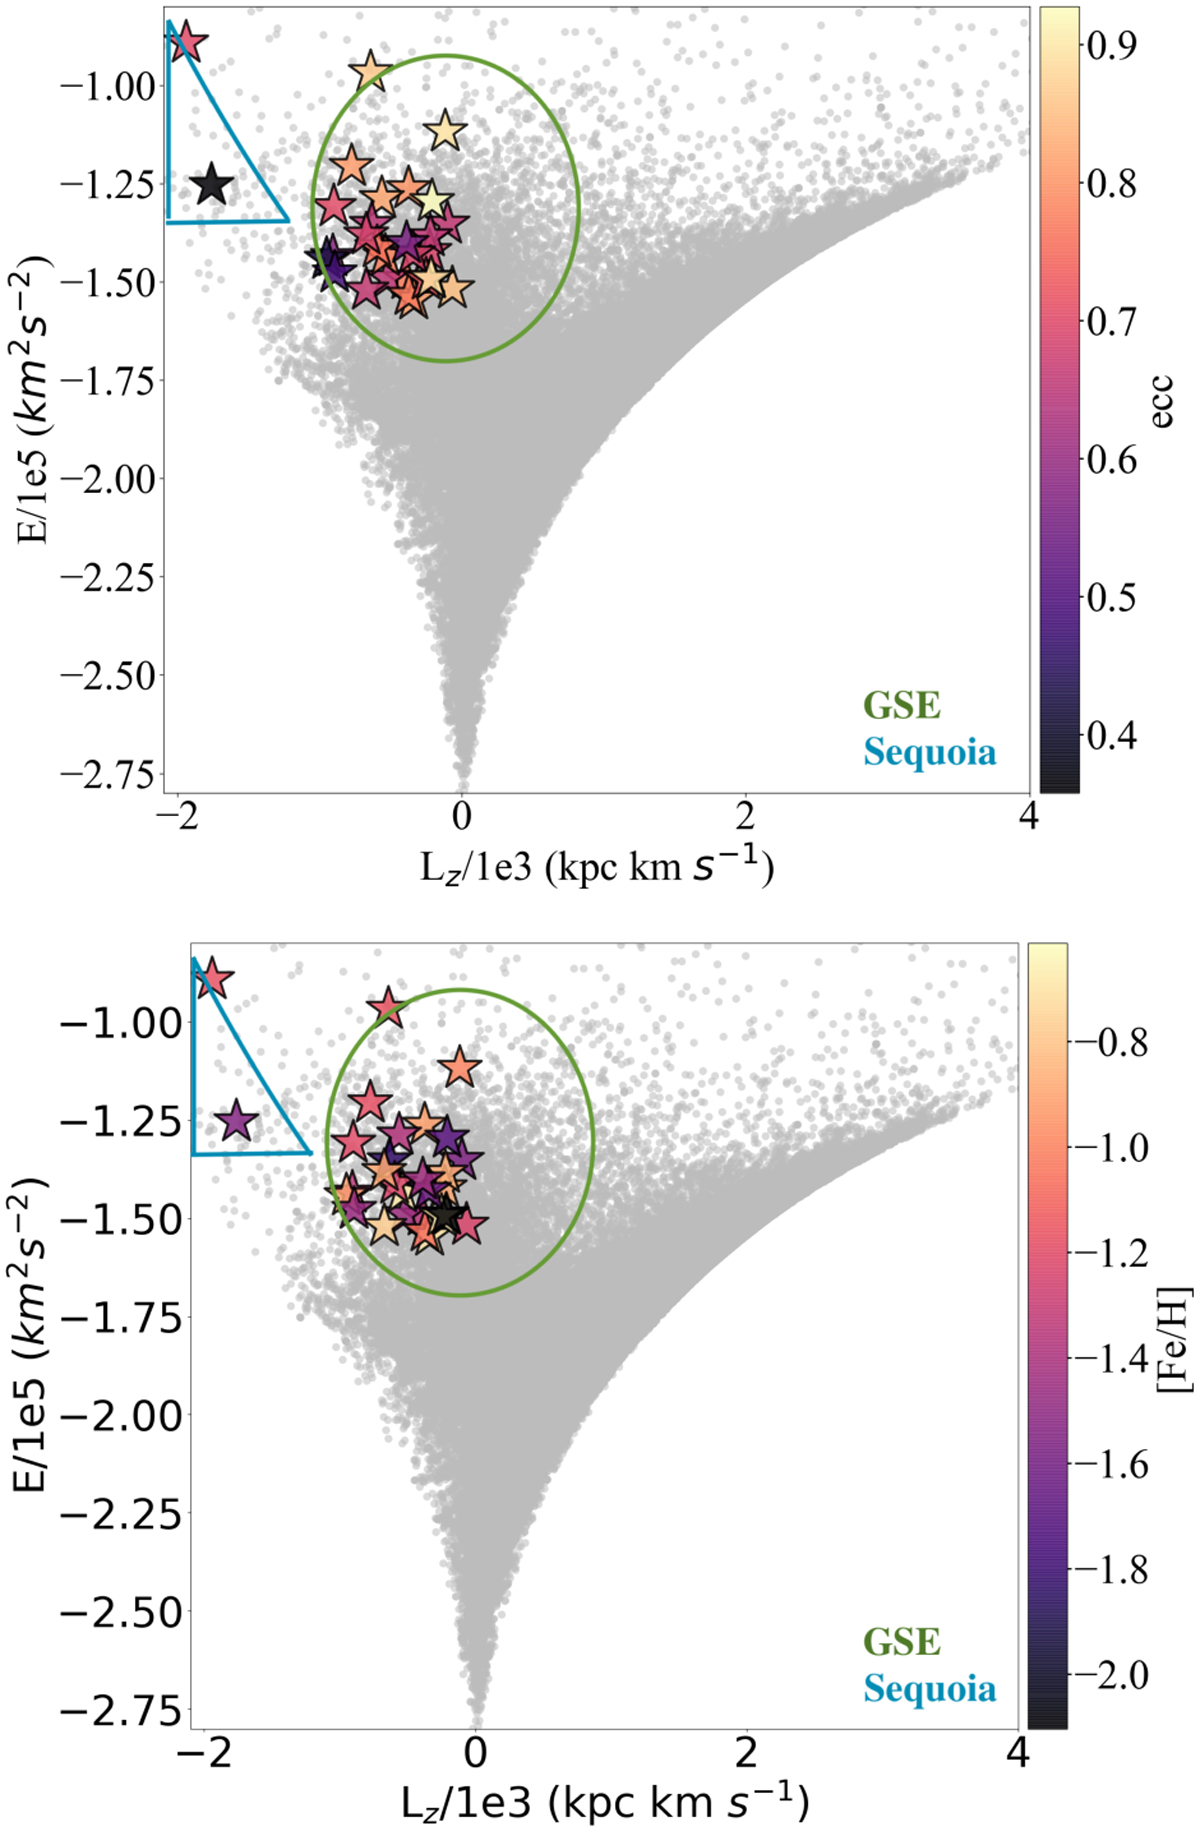
Download original image
Lɀ–E plane. Gray dots represent GALAH DR3 stars, while star markers denote the stars investigated in this study. The top panel displays the stars studied in this work color-coded according to eccentricity, while the bottom panel shows them color-coded according to [Fe/H], The approximate regions corresponding to GSE debris (green ellipse) and Sequoia debris (blue triangle) are indicated in the figure.
Current usage metrics show cumulative count of Article Views (full-text article views including HTML views, PDF and ePub downloads, according to the available data) and Abstracts Views on Vision4Press platform.
Data correspond to usage on the plateform after 2015. The current usage metrics is available 48-96 hours after online publication and is updated daily on week days.
Initial download of the metrics may take a while.