Fig. 1
Download original image
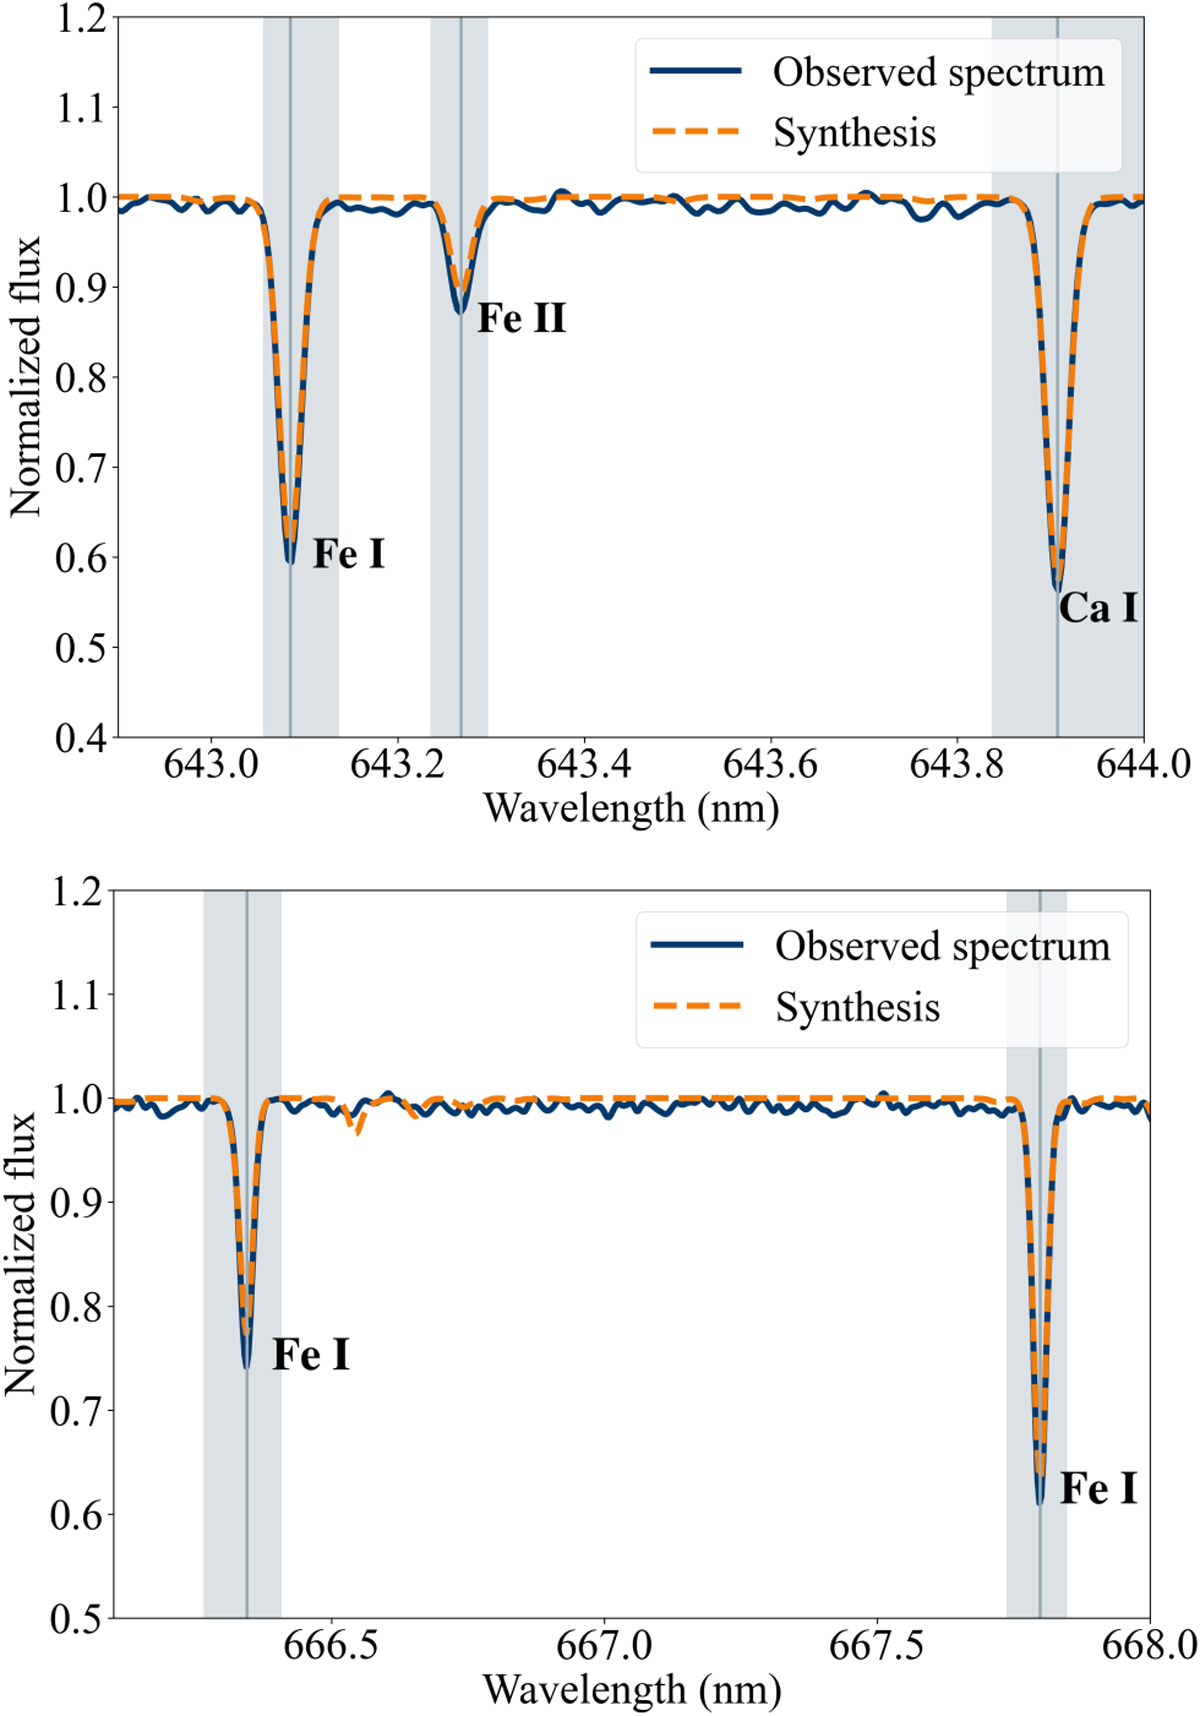
Example region of stellar spectra. An example spectrum obtained with the MIKE spectrograph at the Clay Telescope at Las Campanas Observatory is shown in blue, and a synthetic spectrum built using iSpec (Blanco-Cuaresma et al. 2014; Blanco-Cuaresma 2019) is shown in orange. The gray regions were used to fit the observed spectra to obtain chemical abundances of different elements.
Current usage metrics show cumulative count of Article Views (full-text article views including HTML views, PDF and ePub downloads, according to the available data) and Abstracts Views on Vision4Press platform.
Data correspond to usage on the plateform after 2015. The current usage metrics is available 48-96 hours after online publication and is updated daily on week days.
Initial download of the metrics may take a while.