Open Access
Fig. 9.
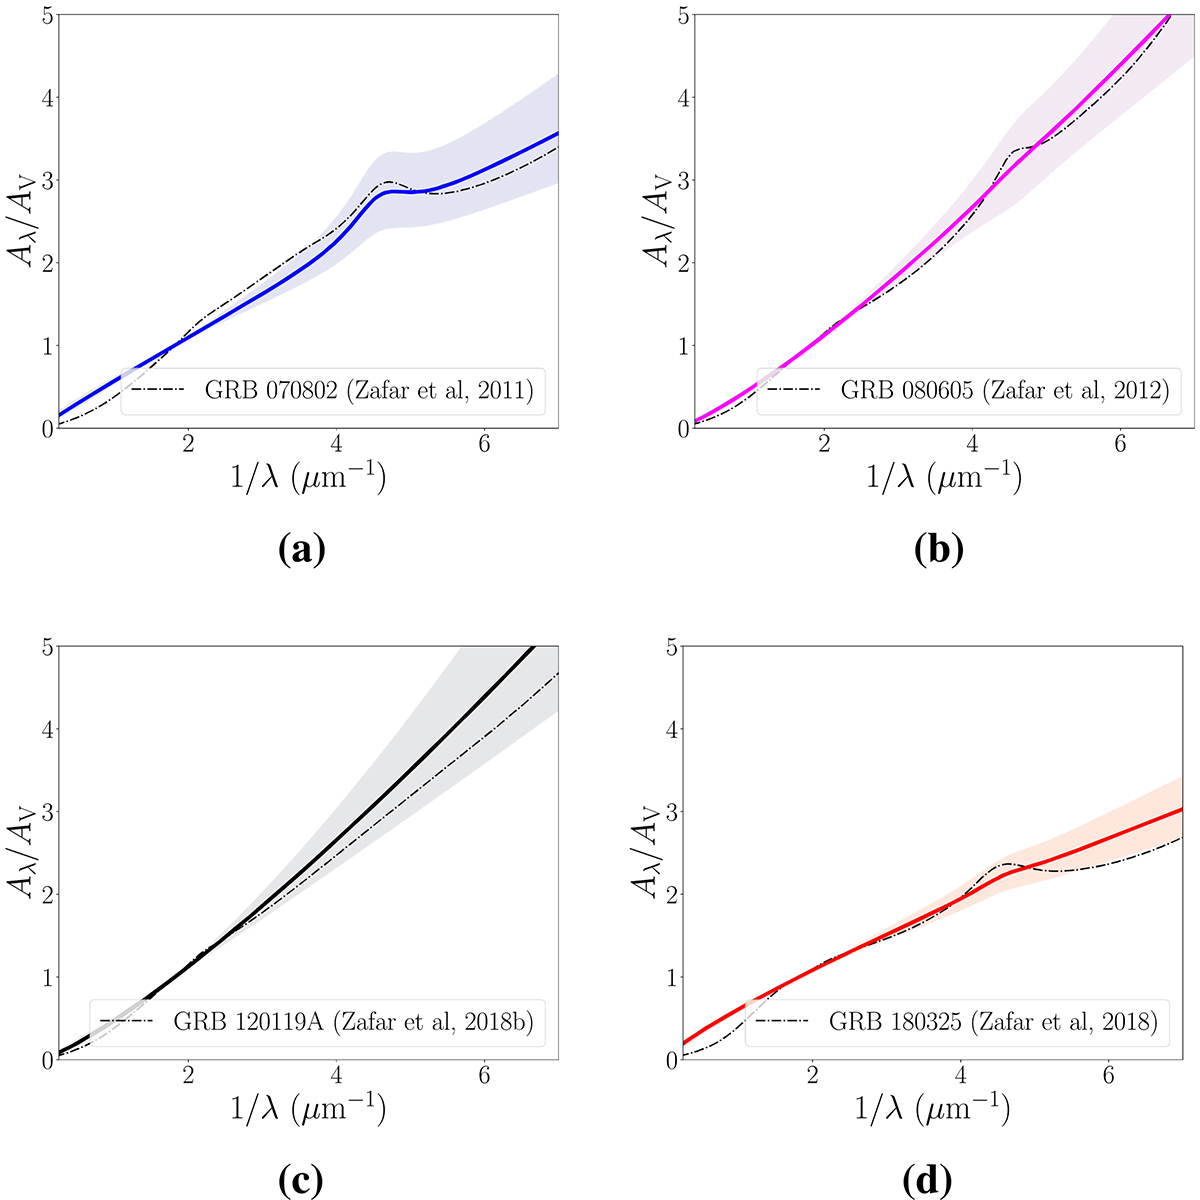
Download original image
Extinction curves of GRB host galaxies derived in this work (colored line and the corresponding 1σ uncertainty in shaded area) compared to the measured curves with spectroscopic data in the literature (black dashed-dotted line). (a) GRB 070802, (b) GRB 080605, (c) GRB 120119A, (d) GRB 180325A.
Current usage metrics show cumulative count of Article Views (full-text article views including HTML views, PDF and ePub downloads, according to the available data) and Abstracts Views on Vision4Press platform.
Data correspond to usage on the plateform after 2015. The current usage metrics is available 48-96 hours after online publication and is updated daily on week days.
Initial download of the metrics may take a while.