Open Access
Fig. 13.
Download original image
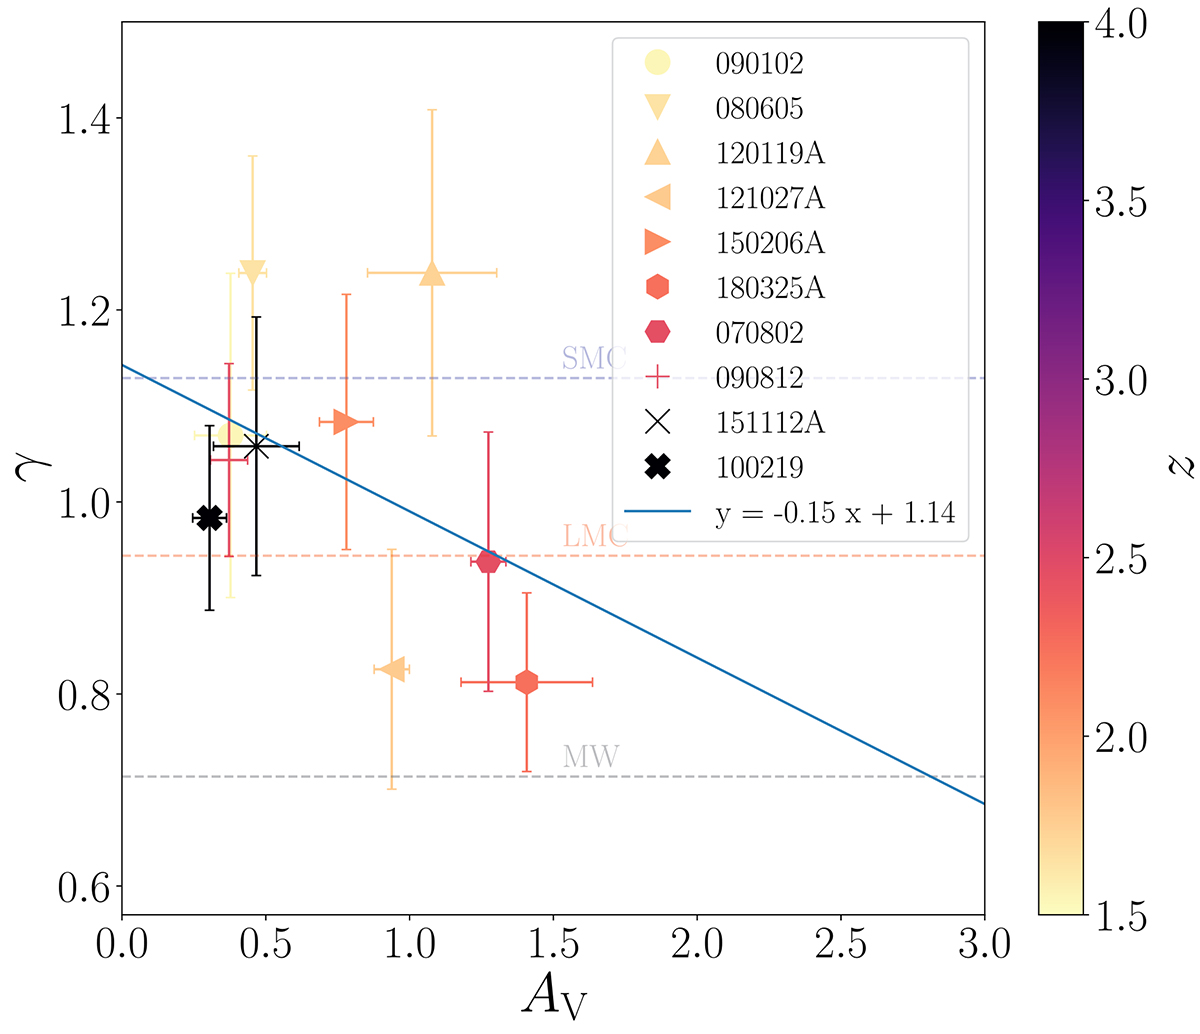
Distribution of γ vs AV for the 10 studies GRBs. Data points are color-coded according to the redshift. Dashed lines correspond to the expected values γ for the average MW, LMC, and SMC laws (Table 1). The blue line illustrates the best fit using an ordinary least-squares linear regression.
Current usage metrics show cumulative count of Article Views (full-text article views including HTML views, PDF and ePub downloads, according to the available data) and Abstracts Views on Vision4Press platform.
Data correspond to usage on the plateform after 2015. The current usage metrics is available 48-96 hours after online publication and is updated daily on week days.
Initial download of the metrics may take a while.