Fig. 1.
Download original image
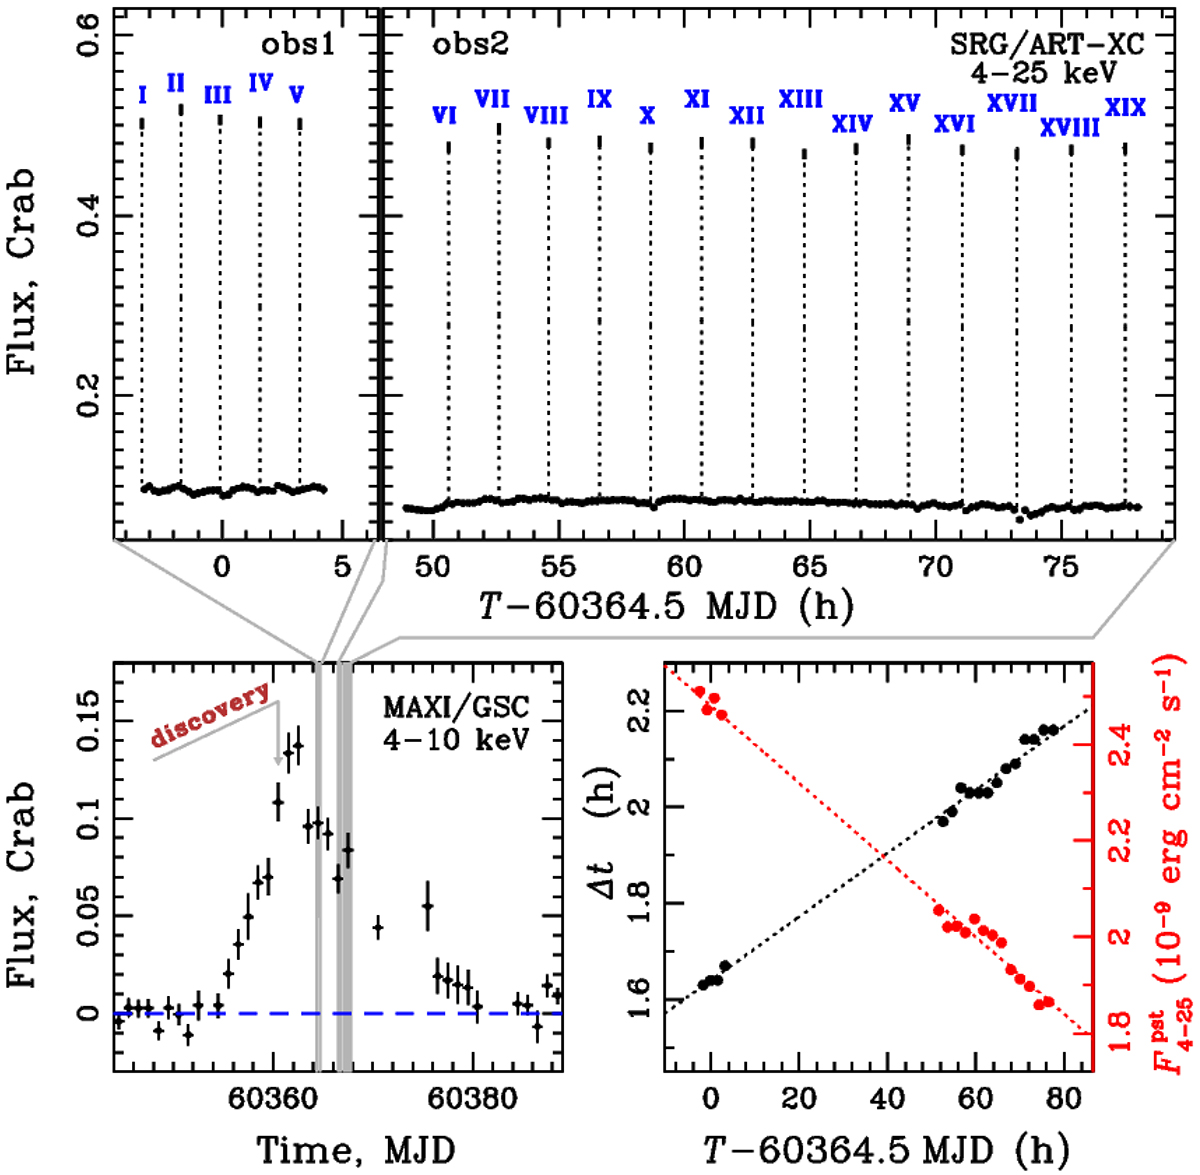
Temporal evolution of the SRGA J1444 emission during the 2024 outburst. Upper panel: ART-XC light curve during two observations. The time and mean flux of the type I X-ray bursts are shown with the dashed line and thick streak. Bottom left: Flux evolution as observed by MAXI/GSC in the 4–10 keV energy band. Bottom right: X-ray burst recurrence time (in black, left axis) and the mean persistent flux between the bursts in the 4–25 keV energy band ![]() (in red, right axis) as measured by ART-XC.
(in red, right axis) as measured by ART-XC.
Current usage metrics show cumulative count of Article Views (full-text article views including HTML views, PDF and ePub downloads, according to the available data) and Abstracts Views on Vision4Press platform.
Data correspond to usage on the plateform after 2015. The current usage metrics is available 48-96 hours after online publication and is updated daily on week days.
Initial download of the metrics may take a while.