Fig. 6.
Download original image
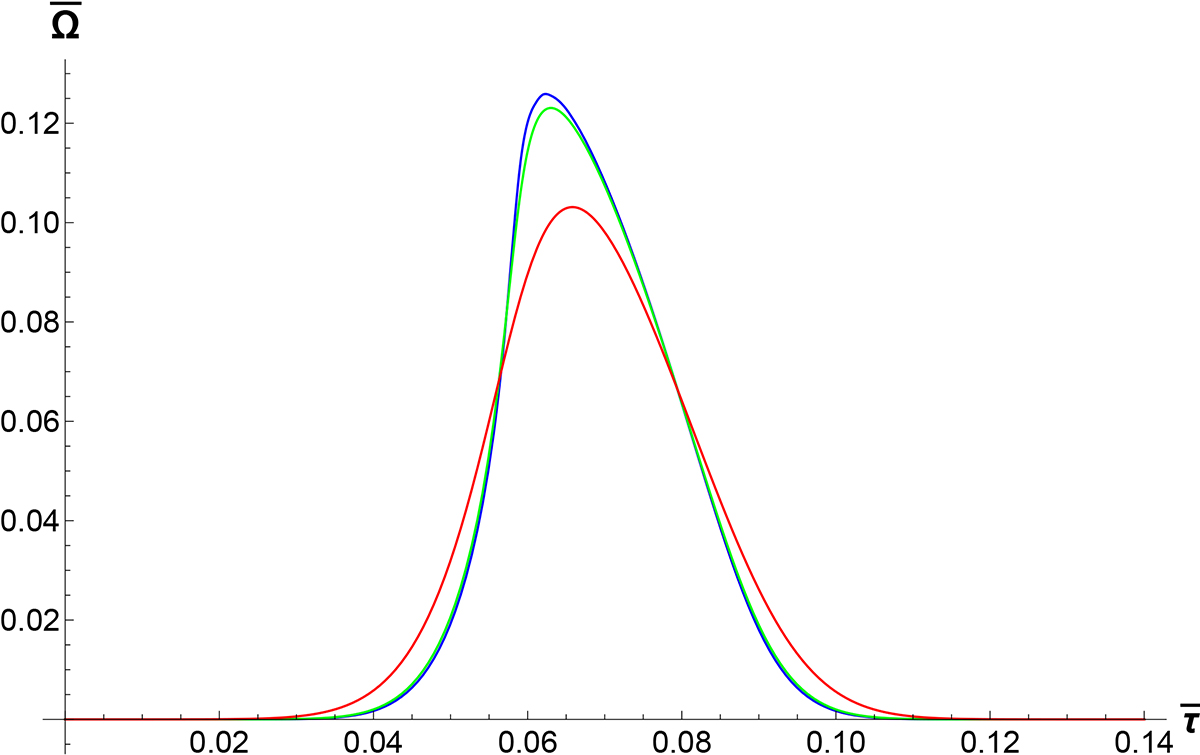
Evolution of an initially Gaussian configuration of an Alfvén wave at a distance of about 140 Mm from the base of the corona is illustrated for three distinct dimensionless viscosities: ![]() (represented by the blue line),
(represented by the blue line), ![]() (depicted with the green line), and
(depicted with the green line), and ![]() (illustrated by the red line). Given the small distinction between the first two diagrams, the green line approximately overlaps with the blue line. The pulse width is taken about 100 seconds, and the initial amplitude is 0.1 which corresponds to the initial azimuthal velocity of 100 km/s. The Alfvén speed near the corona’s base is 1000 km/s.
(illustrated by the red line). Given the small distinction between the first two diagrams, the green line approximately overlaps with the blue line. The pulse width is taken about 100 seconds, and the initial amplitude is 0.1 which corresponds to the initial azimuthal velocity of 100 km/s. The Alfvén speed near the corona’s base is 1000 km/s.
Current usage metrics show cumulative count of Article Views (full-text article views including HTML views, PDF and ePub downloads, according to the available data) and Abstracts Views on Vision4Press platform.
Data correspond to usage on the plateform after 2015. The current usage metrics is available 48-96 hours after online publication and is updated daily on week days.
Initial download of the metrics may take a while.