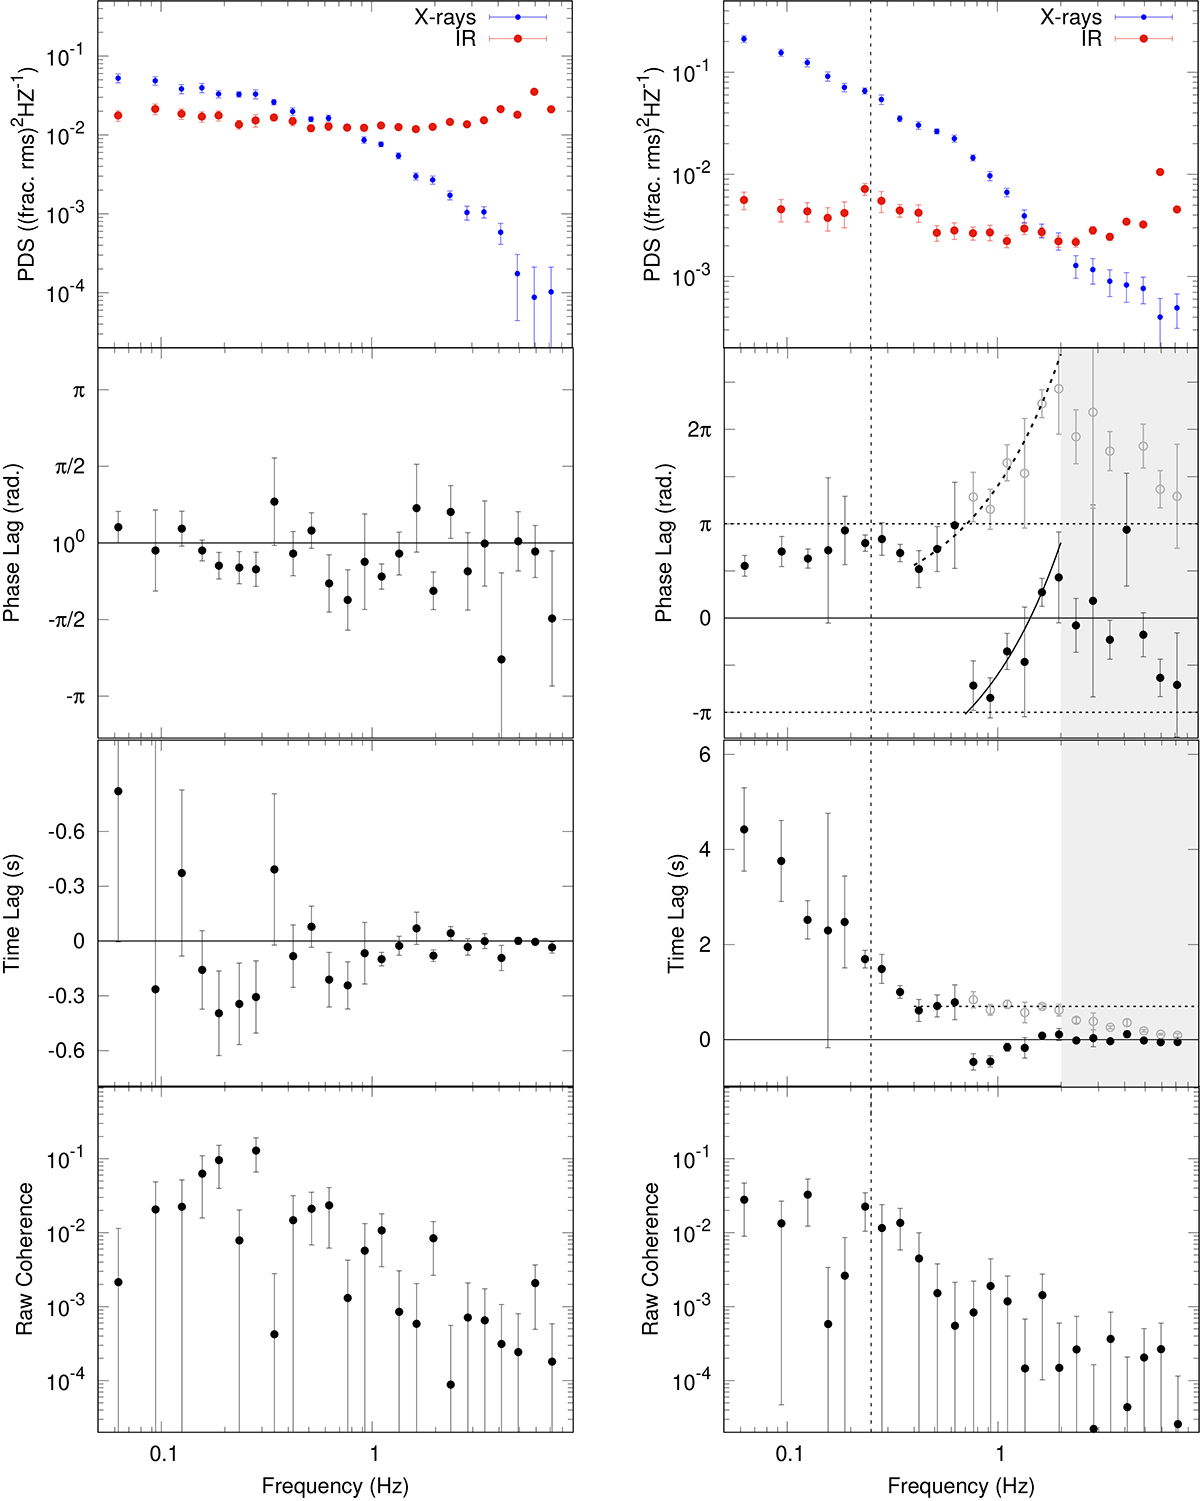
Fig. 3.
Download original image
Fourier domain analysis for the first (left) and second (right) epochs. Top Panels: X-ray (blue) and IR (red) PDS. Counting noise was subtracted from the X-ray PDSs but not from the IR, owing to the instrumental features present in the IR PDS (see Appendix A). Evidence for a quasi-periodic oscillation can be seen at ≈0.25 Hz in the PDS of the second epoch, marked by the vertical dotted line. Second Panels: Phase-lag spectrum. Positive lags mean that IR lags X-rays. While the first epoch generally has a negative lag, the second is dominated by a strong positive lag component. A clear discontinuity caused by phase wrapping is seen in the second epoch. The correction for phase wrapping is shown with grey points. The curved lines mark the estimated constant time lag (with and without phase-wrapping correction). It is apparent that at ∼2 Hz, further phase wrapping occurs, randomising the lags at higher frequencies (grey area). Third Panels: Time lags as a function of Fourier frequency. The horizontal dotted line marks the estimated constant time lag of ∼0.7 seconds between 0.4 and 2 Hz, after correcting for phase wrapping (grey points). Bottom Panels: Raw coherence as a function of the Fourier frequency.
Current usage metrics show cumulative count of Article Views (full-text article views including HTML views, PDF and ePub downloads, according to the available data) and Abstracts Views on Vision4Press platform.
Data correspond to usage on the plateform after 2015. The current usage metrics is available 48-96 hours after online publication and is updated daily on week days.
Initial download of the metrics may take a while.