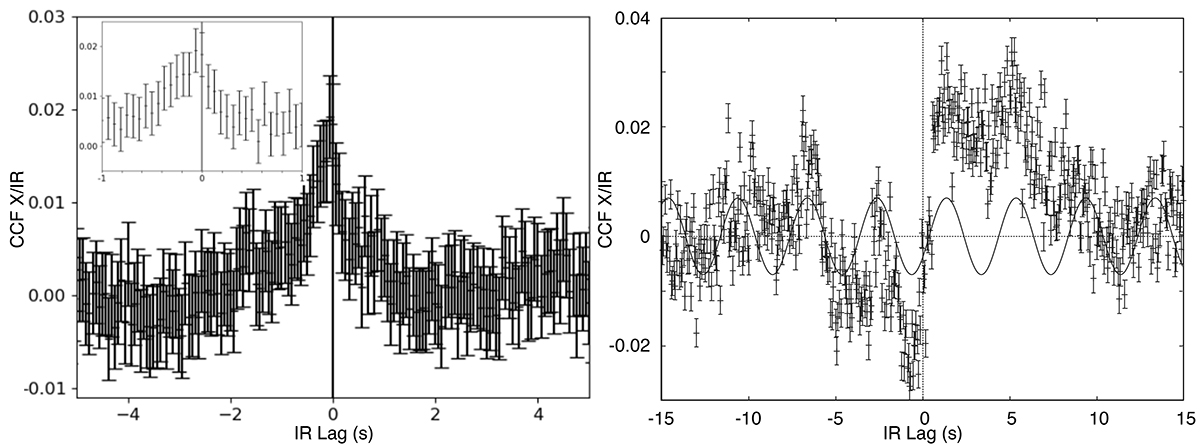
Fig. 2.
Download original image
Infrared/X-ray cross-correlation functions for the first (left) and second (right) epoch, both calculated and plotted with a 62.5 ms time resolution. Positive lags mean that IR lag X-rays. A clear correlation is detected in the first epoch, with a peak at ≈ − 0.13 s. The CCF of the second epoch shows a complex structure, with multiple anti-correlation and correlation features. As shown by the sinusoidal wave (with a period of 4 s), most of the peaks seem to be associated with the QPO at 0.25 Hz visible in the IR PDS (Fig. 3)
Current usage metrics show cumulative count of Article Views (full-text article views including HTML views, PDF and ePub downloads, according to the available data) and Abstracts Views on Vision4Press platform.
Data correspond to usage on the plateform after 2015. The current usage metrics is available 48-96 hours after online publication and is updated daily on week days.
Initial download of the metrics may take a while.