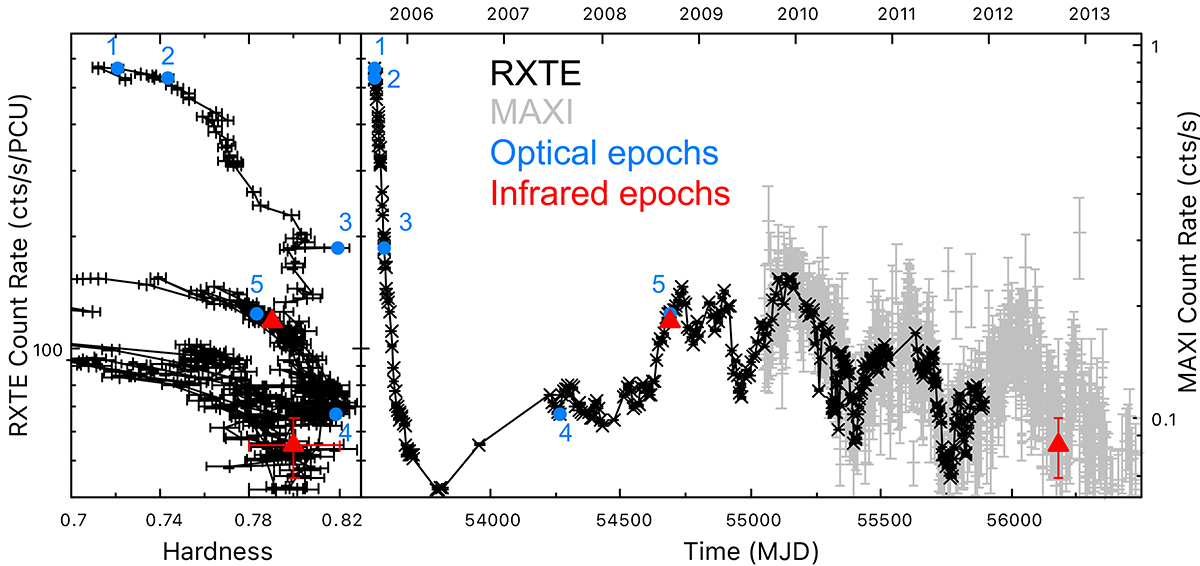
Fig. 1.

Download original image
Hardness-intensity diagram (left) and light curve (right) of the BHT Swift J1753.5–0127 during its ∼10 year-long outburst that started in 2005. The black points represent the RXTE/PCA data: the count rate is in the energy range 2 − 15 keV, while the hardness is the ratio between the rates in the 4 − 9 keV and the rates in the 2 − 4 keV energy ranges. The grey points represent the MAXI data (2 − 15 keV). The blue points indicate the five epochs of optical fast photometry considered in Veledina et al. (2017), while the red triangles indicate the two epochs of IR fast photometry reported in this work. The position of the second IR epoch in the HID and its error bars were estimated from the MAXI scaled count rate and from the ratio (not reported here) between the Swift/BAT and the MAXI scaled count rates and should only be considered as indicative of the approximate position of the source in the HID in that epoch, given the low signal-to-noise ratio of both the MAXI and BAT data. We note that the soft excursions of the source in the HID (reaching values as low as 0.3) have not been plotted for clarity of visualization (see Bu et al. 2019, for a full-scale representation of the HID).
Current usage metrics show cumulative count of Article Views (full-text article views including HTML views, PDF and ePub downloads, according to the available data) and Abstracts Views on Vision4Press platform.
Data correspond to usage on the plateform after 2015. The current usage metrics is available 48-96 hours after online publication and is updated daily on week days.
Initial download of the metrics may take a while.


