Fig. 8
Download original image
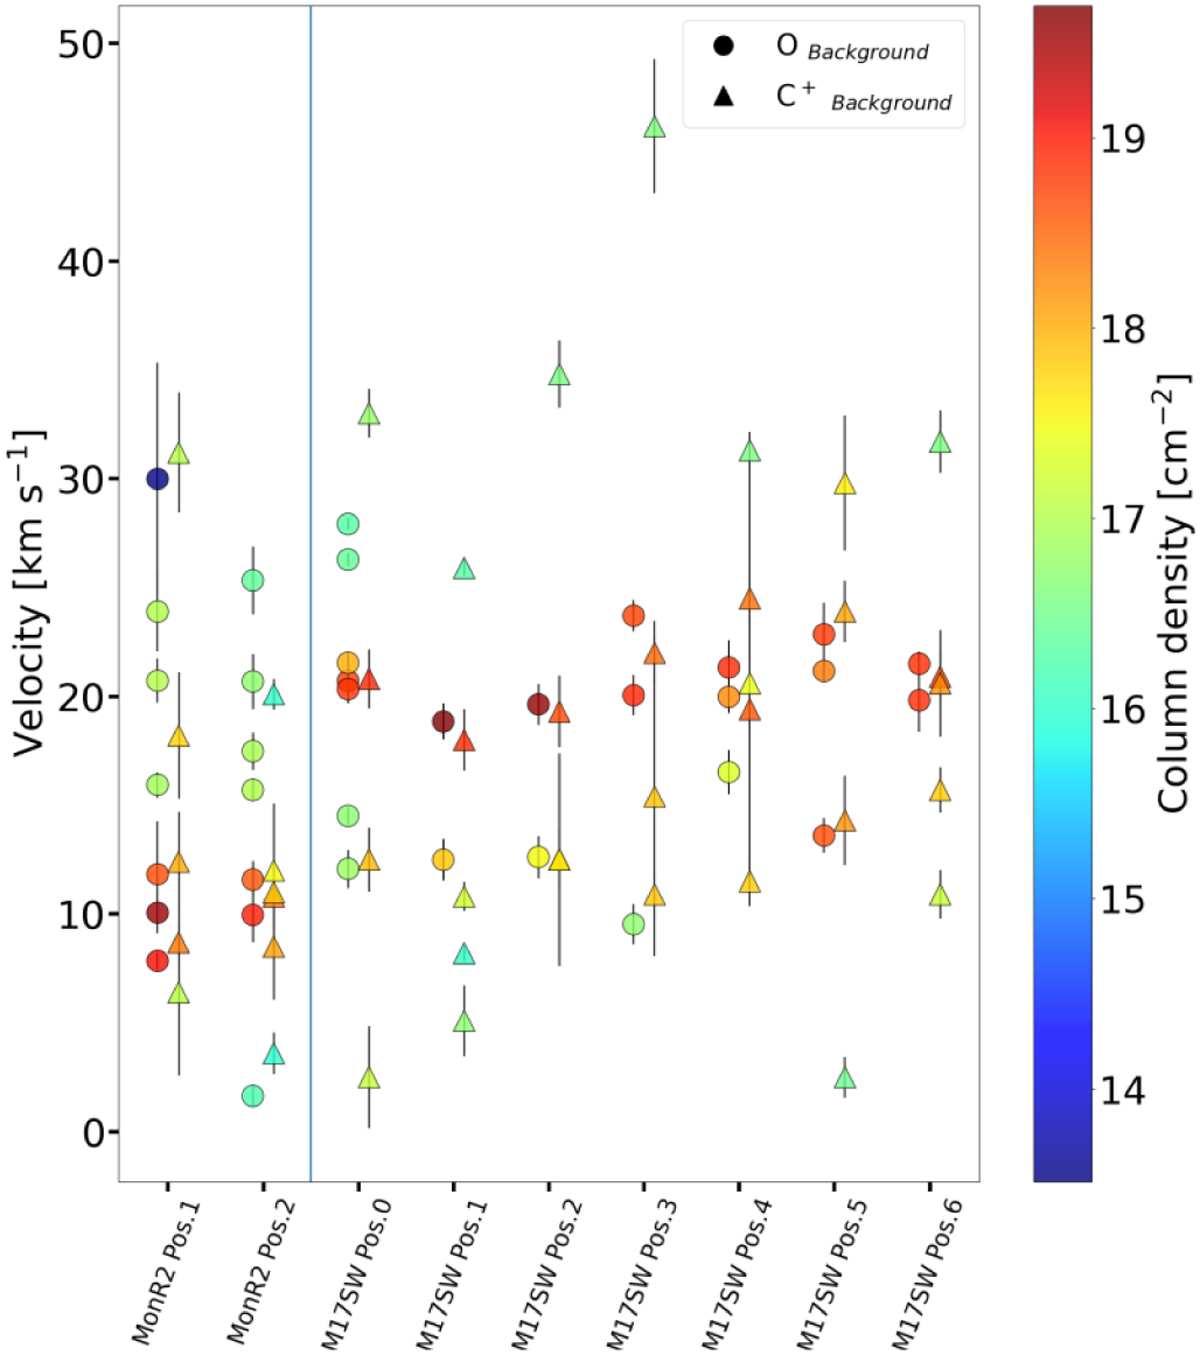
Compilation of background Gaussian parameters for all positions from the multi-component analysis from Sec. 3. Each position is plotted in columns along the velocity axis, showing both atomic lines. Circles symbolize the [O I] Gaussian components for each position and triangles the [ C II] ones (from Guevara et al. 2020). The color of each symbol represents its column density. The length of the vertical bars denotes half of the line width value for a better visualization.
Current usage metrics show cumulative count of Article Views (full-text article views including HTML views, PDF and ePub downloads, according to the available data) and Abstracts Views on Vision4Press platform.
Data correspond to usage on the plateform after 2015. The current usage metrics is available 48-96 hours after online publication and is updated daily on week days.
Initial download of the metrics may take a while.