Open Access
Fig. 6
Download original image
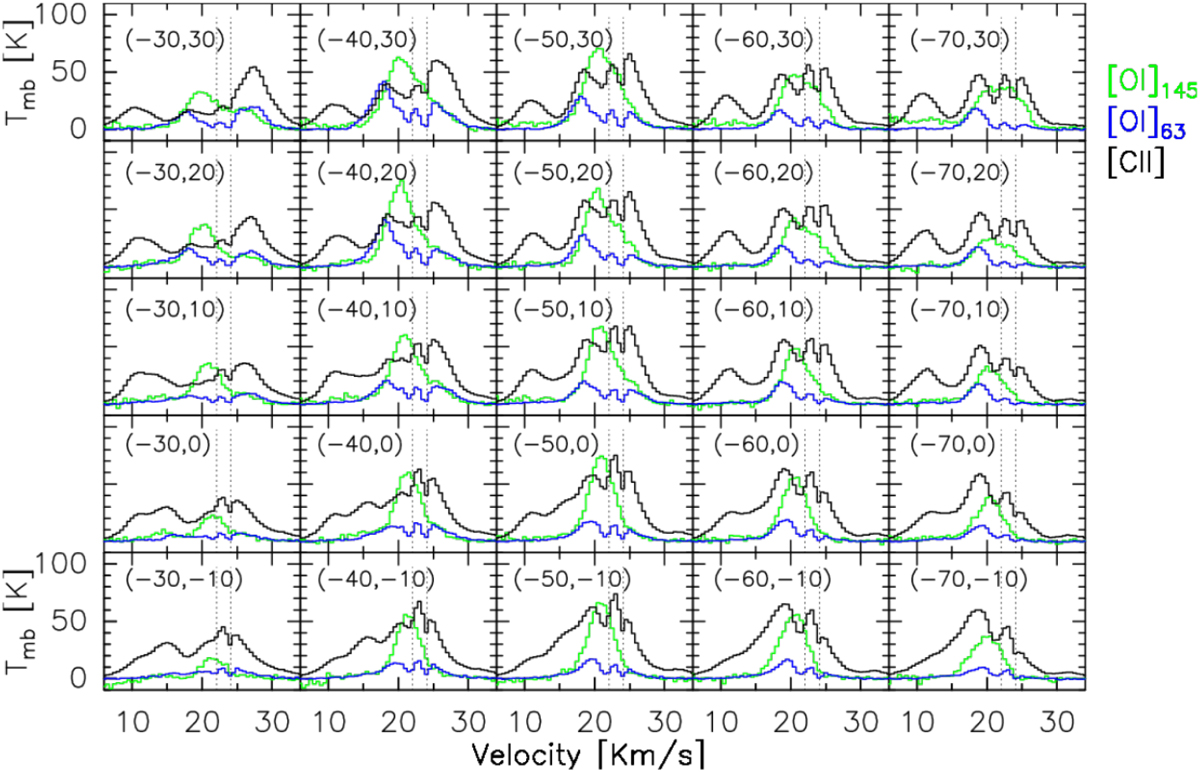
M17 SW [O I] 63 μm, [O I] 145 μm, and [C II] mosaic. The two dotted vertical lines per spectrum are located at 22 and 24 km s−1, respectively, added to guide the eye to the absorption dips. The upper left corner in each box gives the offsets of each spectrum.
Current usage metrics show cumulative count of Article Views (full-text article views including HTML views, PDF and ePub downloads, according to the available data) and Abstracts Views on Vision4Press platform.
Data correspond to usage on the plateform after 2015. The current usage metrics is available 48-96 hours after online publication and is updated daily on week days.
Initial download of the metrics may take a while.