Fig. 1
Download original image
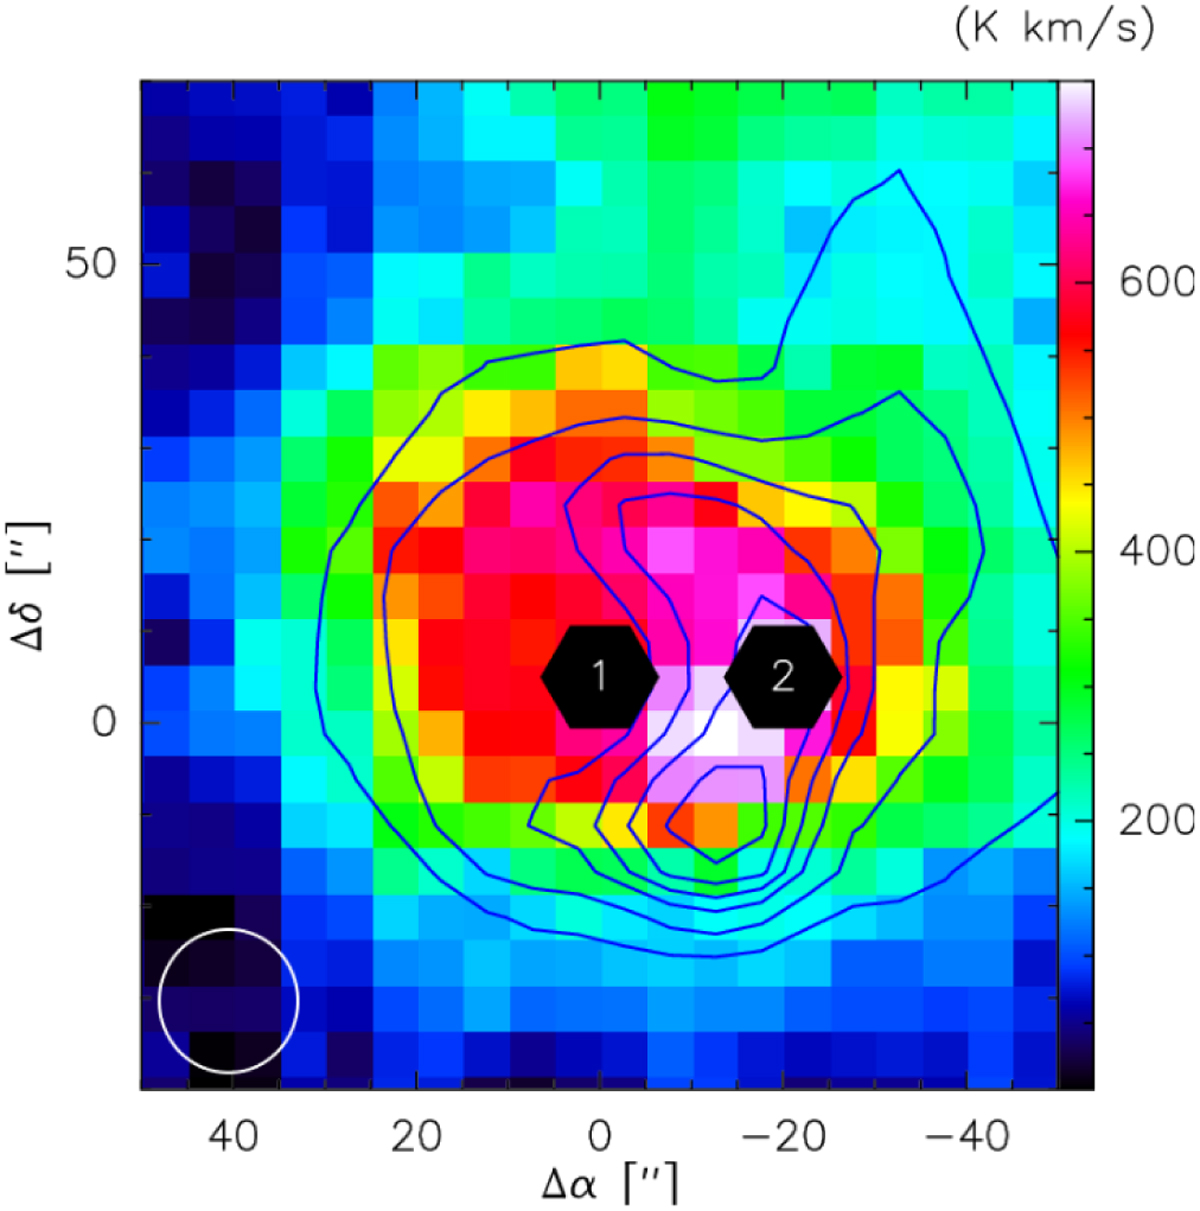
Mon R2 [C II] integrated intensity map for the velocity range between 0 and 30 km s−1 with the two [C II] single pointings (in black) from Guevara et al. (2020). [O I] 63 μm integrated intensity map in blue contours covering the same velocity range of [C II] (levels at 100, 150, 200, 240, 270, and 300 K km s−1). The white circle represents the FWHM beam size of both maps, 15″.
Current usage metrics show cumulative count of Article Views (full-text article views including HTML views, PDF and ePub downloads, according to the available data) and Abstracts Views on Vision4Press platform.
Data correspond to usage on the plateform after 2015. The current usage metrics is available 48-96 hours after online publication and is updated daily on week days.
Initial download of the metrics may take a while.