Fig. 9
Download original image
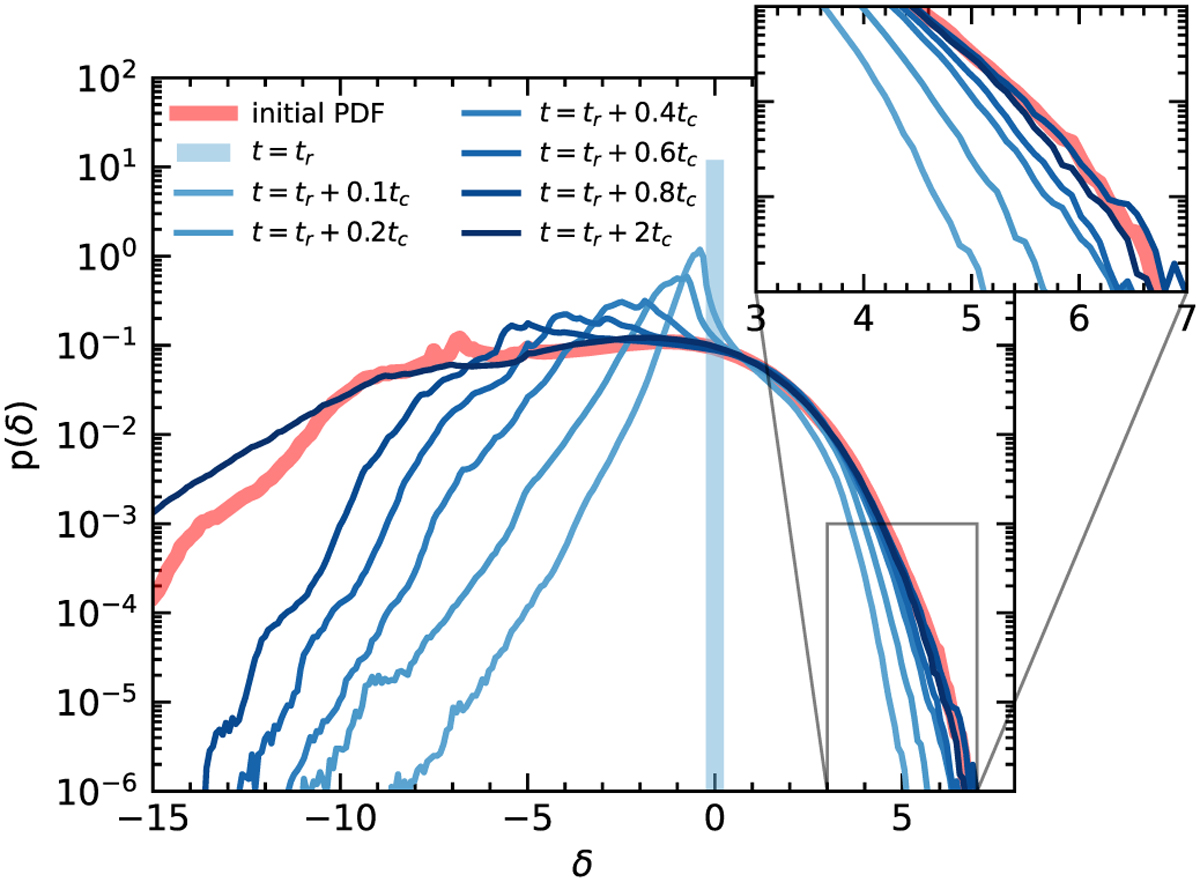
Evolution of the density PDF (δ = ln(ρ/ρ0)) after the density was reset at ρ0 from a snapshot of the simulation L1000_N512_comp0.5_frmsle4. The red line is the PDF just before the reset, and the blue lines corresponds to different times given in units of the crossing time of the turbulence tc. We call tr := 2tc the time at which the density has been reset.
Current usage metrics show cumulative count of Article Views (full-text article views including HTML views, PDF and ePub downloads, according to the available data) and Abstracts Views on Vision4Press platform.
Data correspond to usage on the plateform after 2015. The current usage metrics is available 48-96 hours after online publication and is updated daily on week days.
Initial download of the metrics may take a while.