Fig. 7
Download original image
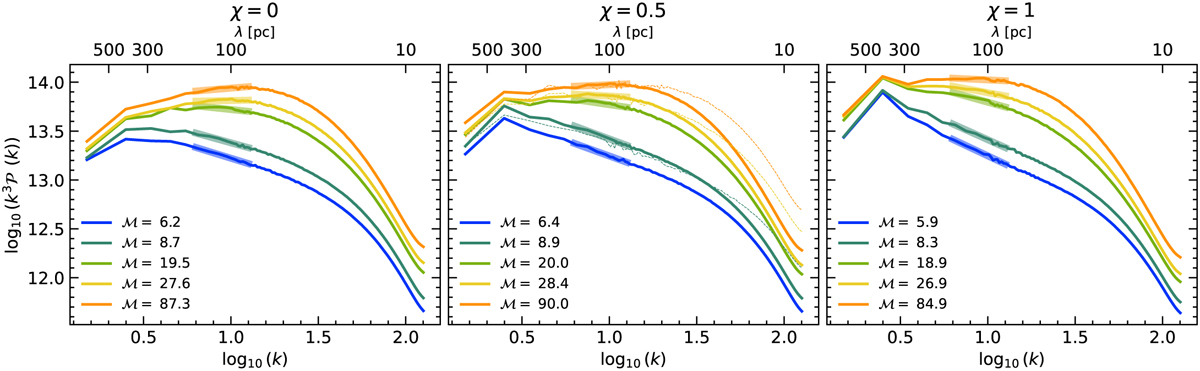
Power spectra of the natural logarithm of density for the simulation of the group L1000_512 (solid) and L1000_1024 (dotted lines in middle panel). The thicker range show the captured inertial range used to fit the slope and compute ηd in Fig. 8. It is defined as the portion of the curve that is left unchanged when resolution is increased. The displayed power spectra are compensated (multplied by k3) such that a power-law slope of −3 is horizontal on the plot.
Current usage metrics show cumulative count of Article Views (full-text article views including HTML views, PDF and ePub downloads, according to the available data) and Abstracts Views on Vision4Press platform.
Data correspond to usage on the plateform after 2015. The current usage metrics is available 48-96 hours after online publication and is updated daily on week days.
Initial download of the metrics may take a while.