Open Access
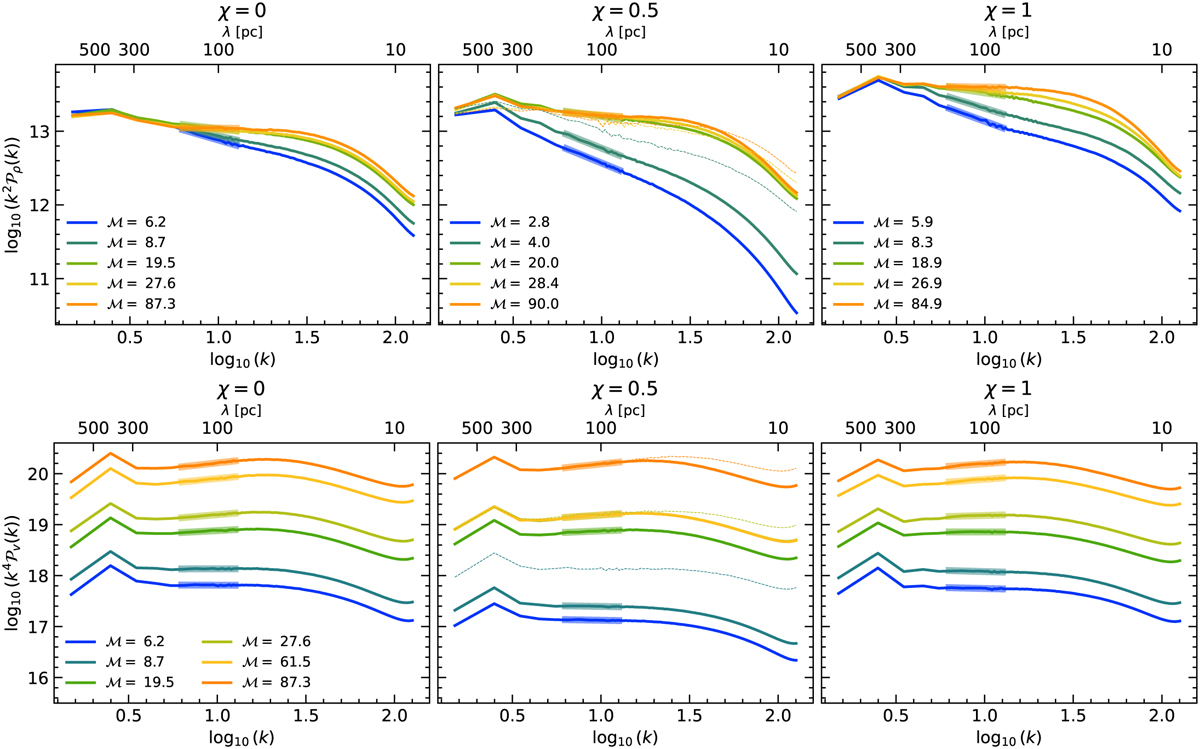
Fig. C.1
Download original image
Power spectrum of the density (top) and the norm of the velocity (bottom) for the group L1000_512 (solid lines) and L1000_1024 (dotted lines in the middle panel).
Current usage metrics show cumulative count of Article Views (full-text article views including HTML views, PDF and ePub downloads, according to the available data) and Abstracts Views on Vision4Press platform.
Data correspond to usage on the plateform after 2015. The current usage metrics is available 48-96 hours after online publication and is updated daily on week days.
Initial download of the metrics may take a while.