Open Access
Fig. 7.
Download original image
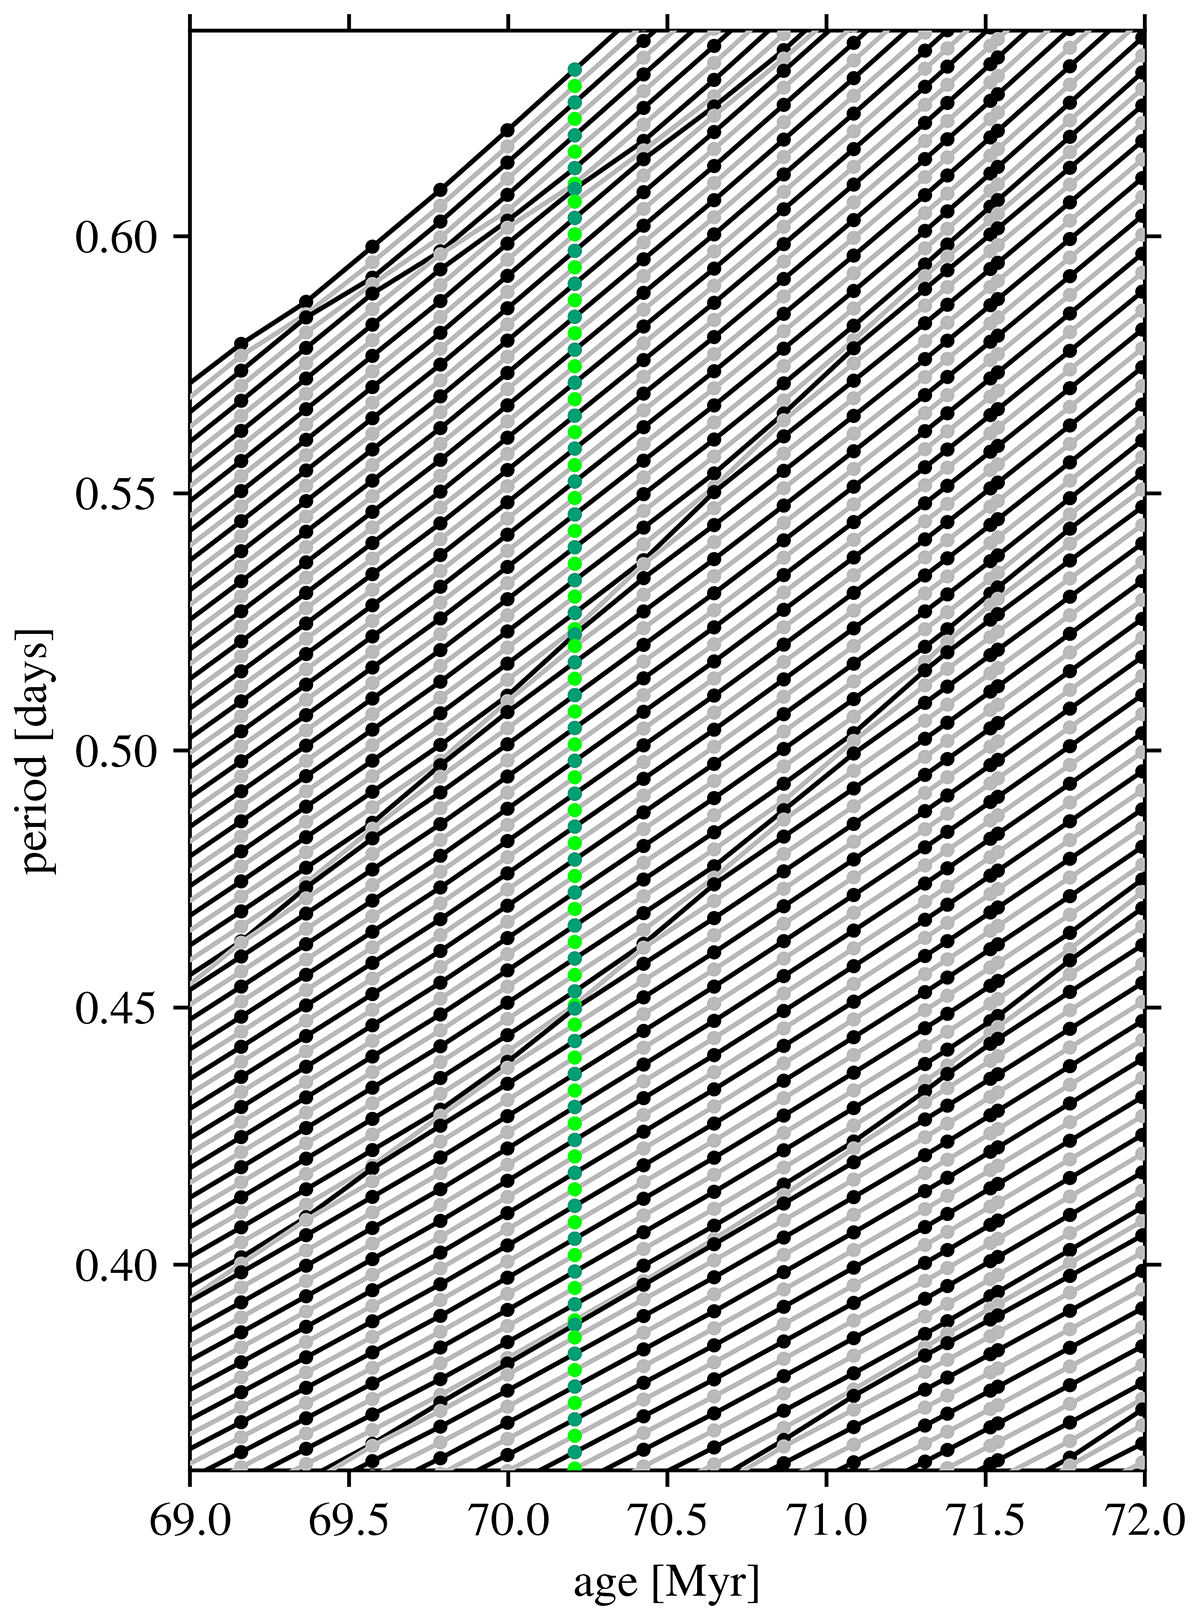
Zoomed-in view of a mode-bumping diagram for (ℓ, m) = (2, 0) modes of the merger product with M⋆ = 6.0 + 2.4 M⊙. The black (grey) lines show the evolution of the mode period of g modes with even (odd) radial order npg. The green (lime) symbols indicate periods of the even (odd) modes shown in Fig. 8.
Current usage metrics show cumulative count of Article Views (full-text article views including HTML views, PDF and ePub downloads, according to the available data) and Abstracts Views on Vision4Press platform.
Data correspond to usage on the plateform after 2015. The current usage metrics is available 48-96 hours after online publication and is updated daily on week days.
Initial download of the metrics may take a while.