Open Access
Fig. 6.
Download original image
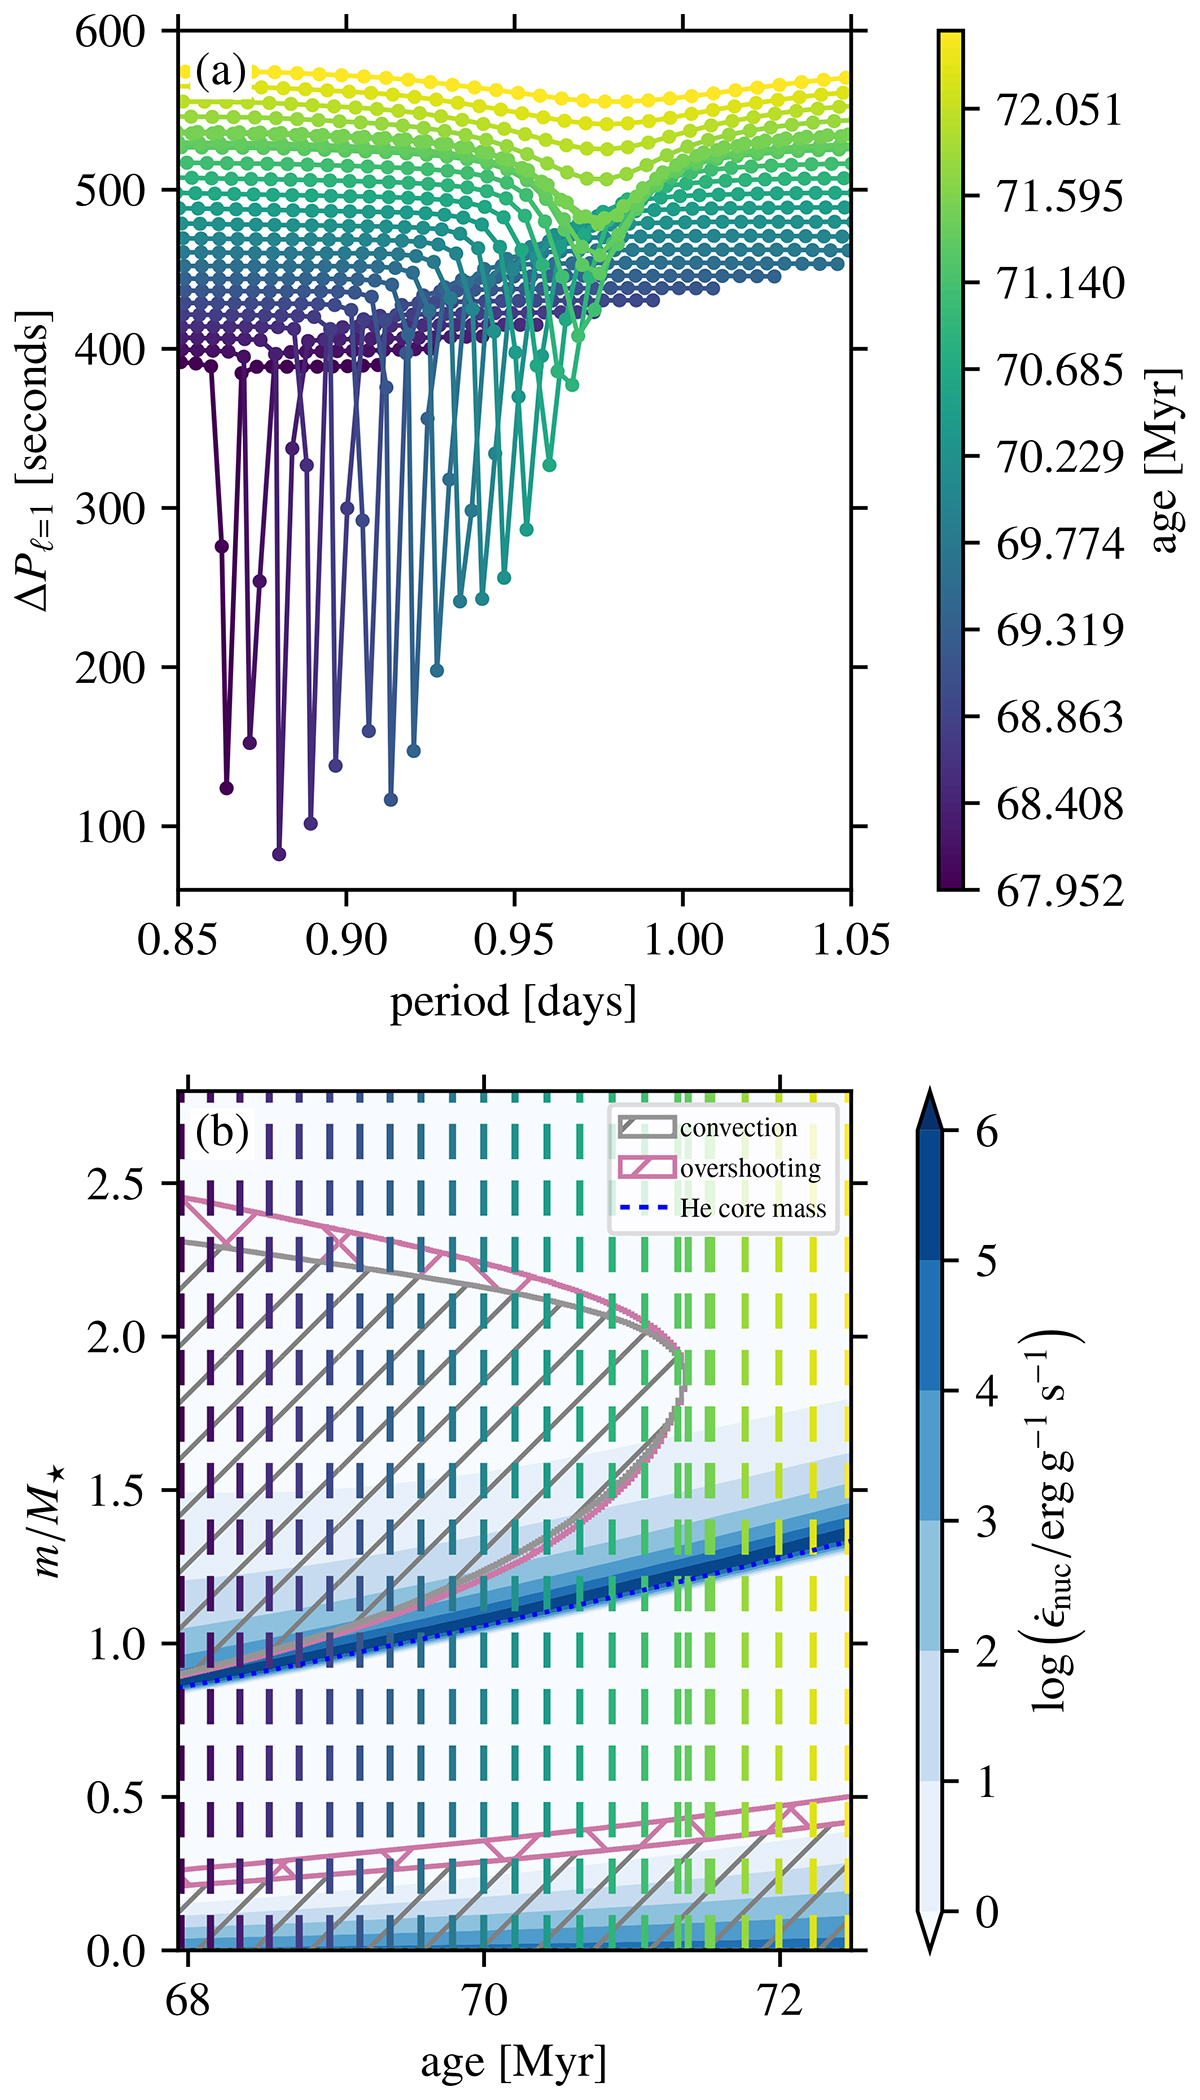
Temporal evolution of the deep PSP dip for the merger product with M⋆ = 6.0 + 2.4 M⊙. Panel (a) shows the PSP dip for (ℓ, m) = (1, 0) modes around 0.92 days. Panel (b) shows a zoomed-in view of the Kippenhahn diagram from Fig. 2c. The colours of the vertical dashed lines correspond to those in Panel (a).
Current usage metrics show cumulative count of Article Views (full-text article views including HTML views, PDF and ePub downloads, according to the available data) and Abstracts Views on Vision4Press platform.
Data correspond to usage on the plateform after 2015. The current usage metrics is available 48-96 hours after online publication and is updated daily on week days.
Initial download of the metrics may take a while.