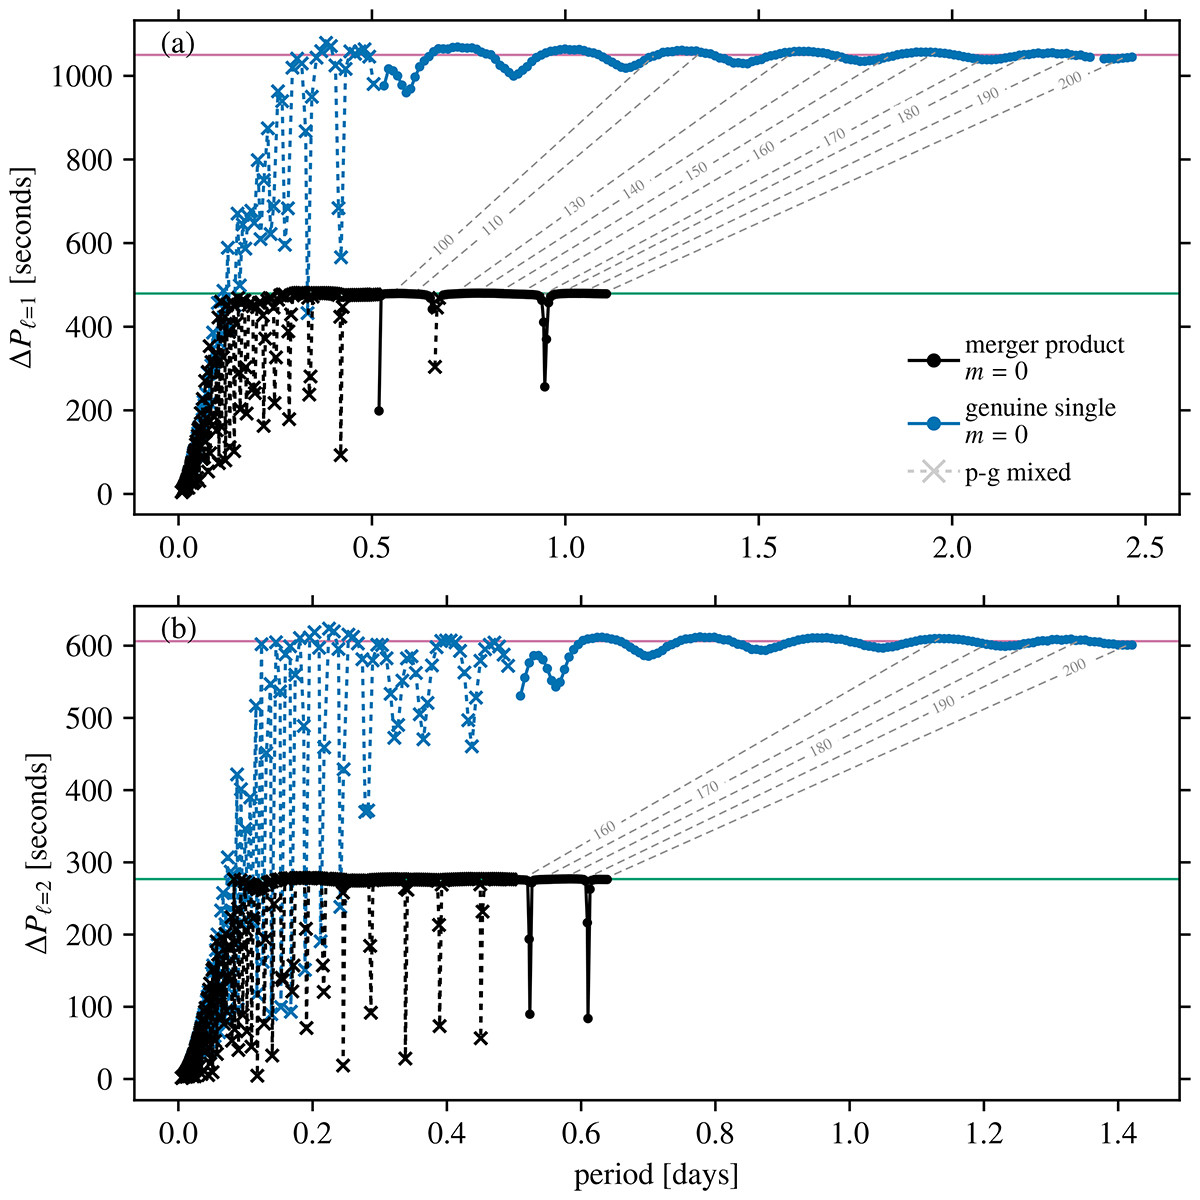
Fig. 3.
Download original image
PSPs for the 6.0 + 2.4 M⊙ merger product (black) and the 7.8 M⊙ genuine HG star (blue) without rotation at the time of comparison (violet box in Fig. 1). The dashed grey lines connect pure g modes with the same radial order ng. The dashed black and grey lines with cross symbols indicate p-g mixed modes. These p-g mixed modes have at least one node in the radial direction, that is, np > 0. Panel (a) and (b) show the PSPs for (ℓ, m) = (1, 0) and (2, 0) modes, respectively. The green and purple horizontal lines indicate the Πℓ values for the merger product and genuine single star, respectively.
Current usage metrics show cumulative count of Article Views (full-text article views including HTML views, PDF and ePub downloads, according to the available data) and Abstracts Views on Vision4Press platform.
Data correspond to usage on the plateform after 2015. The current usage metrics is available 48-96 hours after online publication and is updated daily on week days.
Initial download of the metrics may take a while.