Fig. E.2.
Download original image
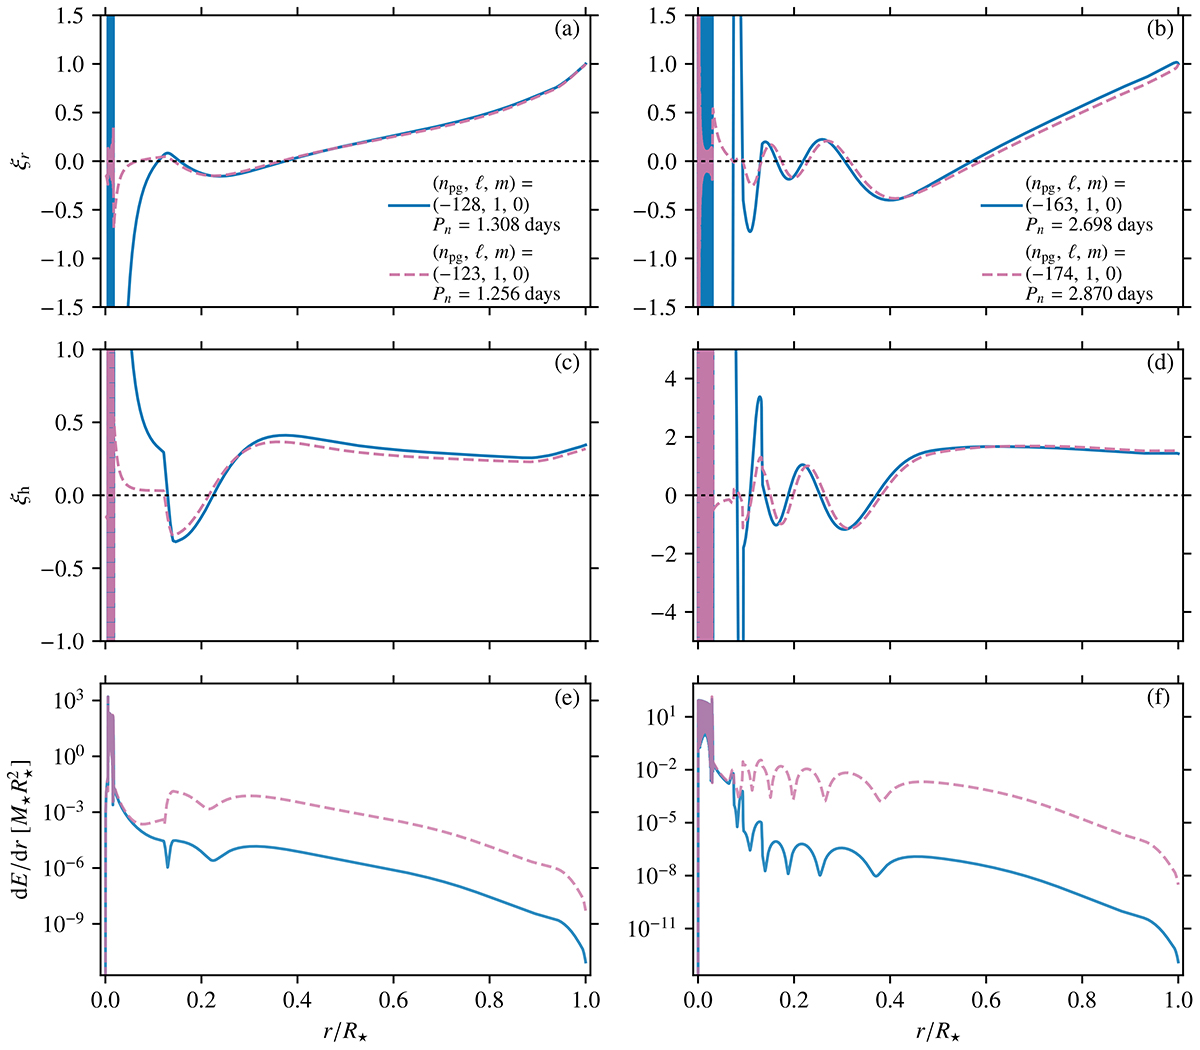
Same as Fig. E.1 but for the 9.0 + 6.3 M⊙ merger product (left column) and 13.6 M⊙ genuine single star (right column). The dashed pink lines in all panels show the aforementioned quantities for a mode in a deep PSP dip. The solid blue lines show those for a mode outside of a deep PSP dip, that is, for an inner-cavity g mode.
Current usage metrics show cumulative count of Article Views (full-text article views including HTML views, PDF and ePub downloads, according to the available data) and Abstracts Views on Vision4Press platform.
Data correspond to usage on the plateform after 2015. The current usage metrics is available 48-96 hours after online publication and is updated daily on week days.
Initial download of the metrics may take a while.