Fig. 2.
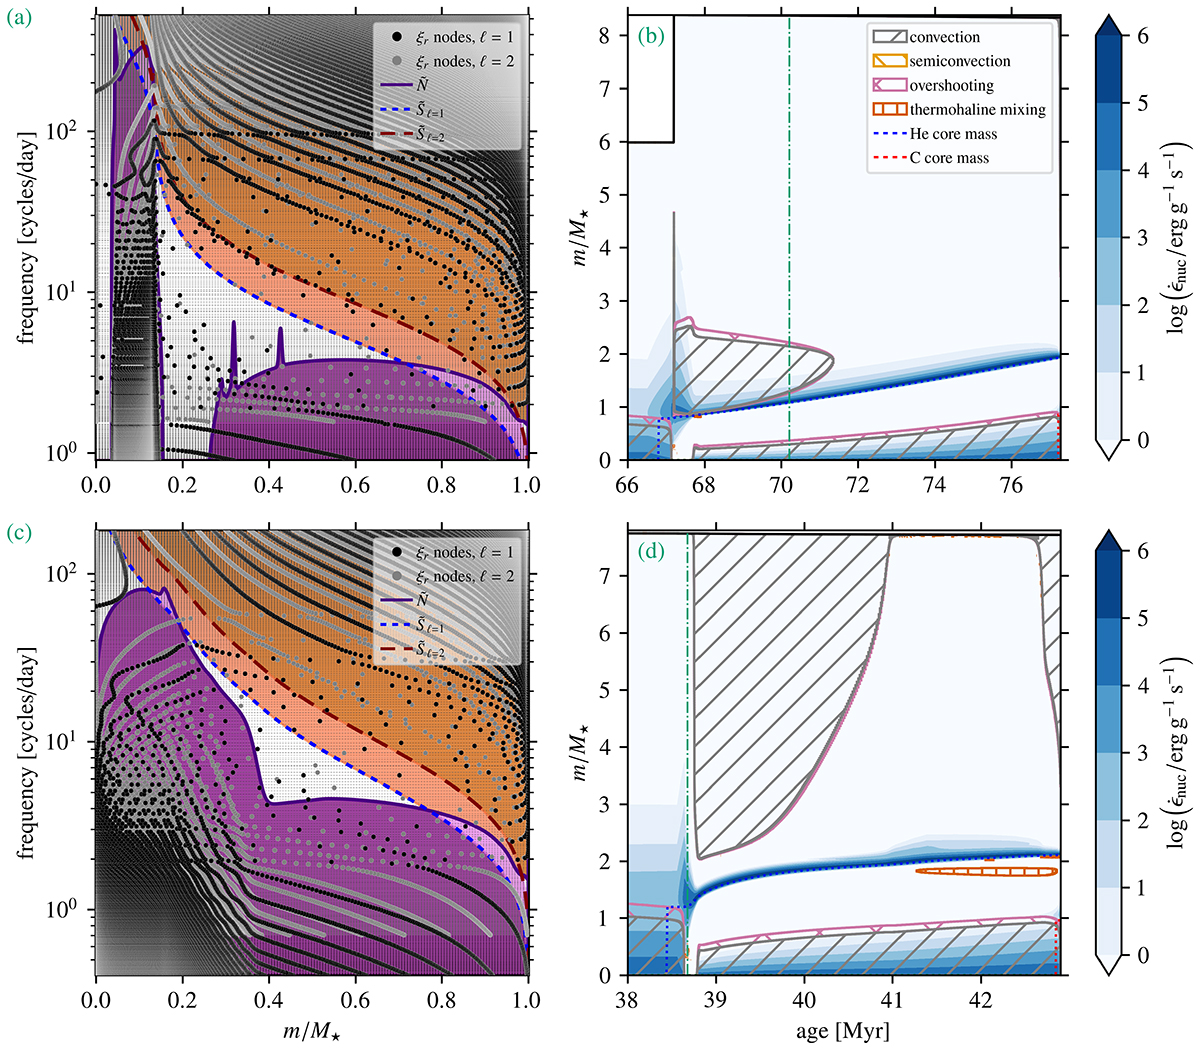
Download original image
Propagation and Kippenhahn diagrams for the M⋆ = 6.0 + 2.4 M⊙ merger product and M⋆ = 7.8 M⊙ genuine single star. Panels (a) and (c) show propagation diagrams for ℓ = 1, 2 and m = 0 modes without rotation for the merger product with M⋆ = 6.0 + 2.4 M⊙ and genuine single star with M⋆ = 7.8 M⊙, respectively. The black (grey) dots represent the radial nodes of the oscillation modes, or more specifically, the locations where the radial wave displacement ξr(r) = 0 for the ℓ = 1 (ℓ = 2) modes. The purple regions show the g-mode cavity or cavities, while the orange region shows the p-mode cavity. Panels (b) and (d) show Kippenhahn diagrams for the merger product with M⋆ = 6.0 + 2.4 M⊙ and a genuine single star with M⋆ = 7.8 M⊙, respectively. The dash-dotted green lines indicate the models for which the respective propagation diagrams in Panels (a) and (c) are shown, which is when their HRD tracks overlap, indicated by the violet box in Fig. 1a. Both Kippenhahn diagrams show the evolution of the models up to core-helium exhaustion.
Current usage metrics show cumulative count of Article Views (full-text article views including HTML views, PDF and ePub downloads, according to the available data) and Abstracts Views on Vision4Press platform.
Data correspond to usage on the plateform after 2015. The current usage metrics is available 48-96 hours after online publication and is updated daily on week days.
Initial download of the metrics may take a while.