Open Access
Fig. B.1.
Download original image
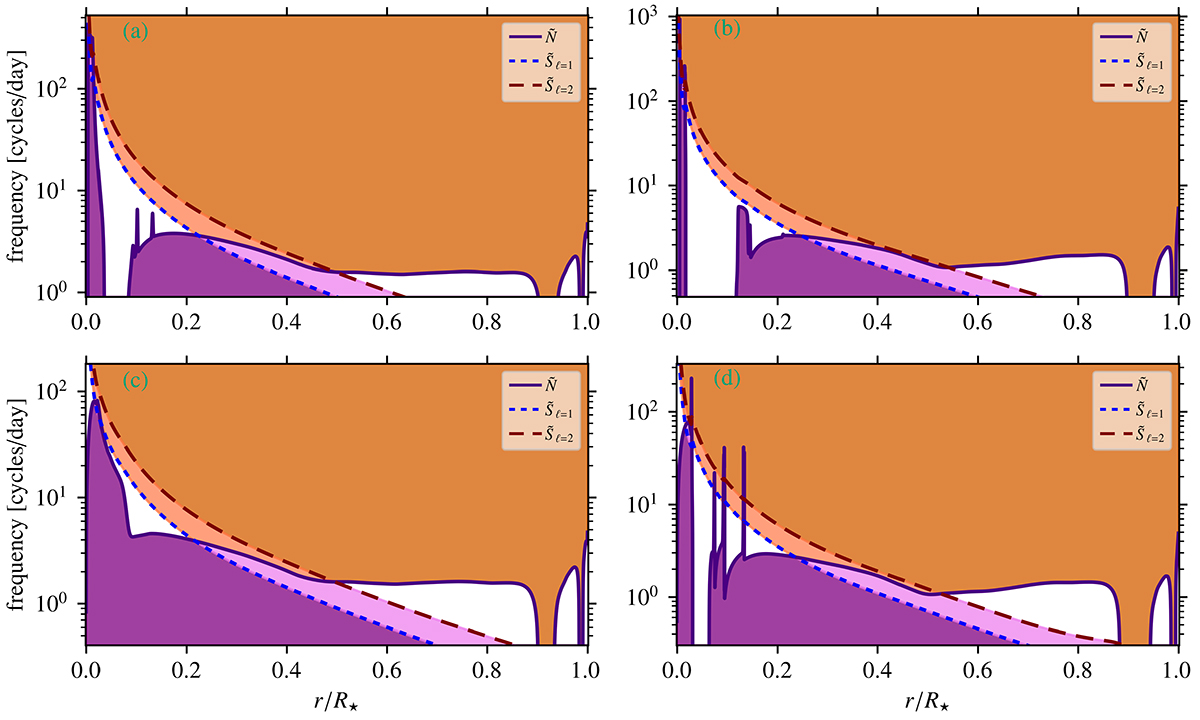
Propagation diagrams of the 6.0 + 2.4 M⊙ merger product (a) and 7.8 M⊙ (c) genuine single star, and the 9.0 + 6.3 M⊙ merger product (b) and 13.6 M⊙ genuine single star (d) from Fig. 2 and Fig. 4, respectively, now as a function of the relative radial coordinate, r/R⋆. The ξr nodes are left out for clarity.
Current usage metrics show cumulative count of Article Views (full-text article views including HTML views, PDF and ePub downloads, according to the available data) and Abstracts Views on Vision4Press platform.
Data correspond to usage on the plateform after 2015. The current usage metrics is available 48-96 hours after online publication and is updated daily on week days.
Initial download of the metrics may take a while.