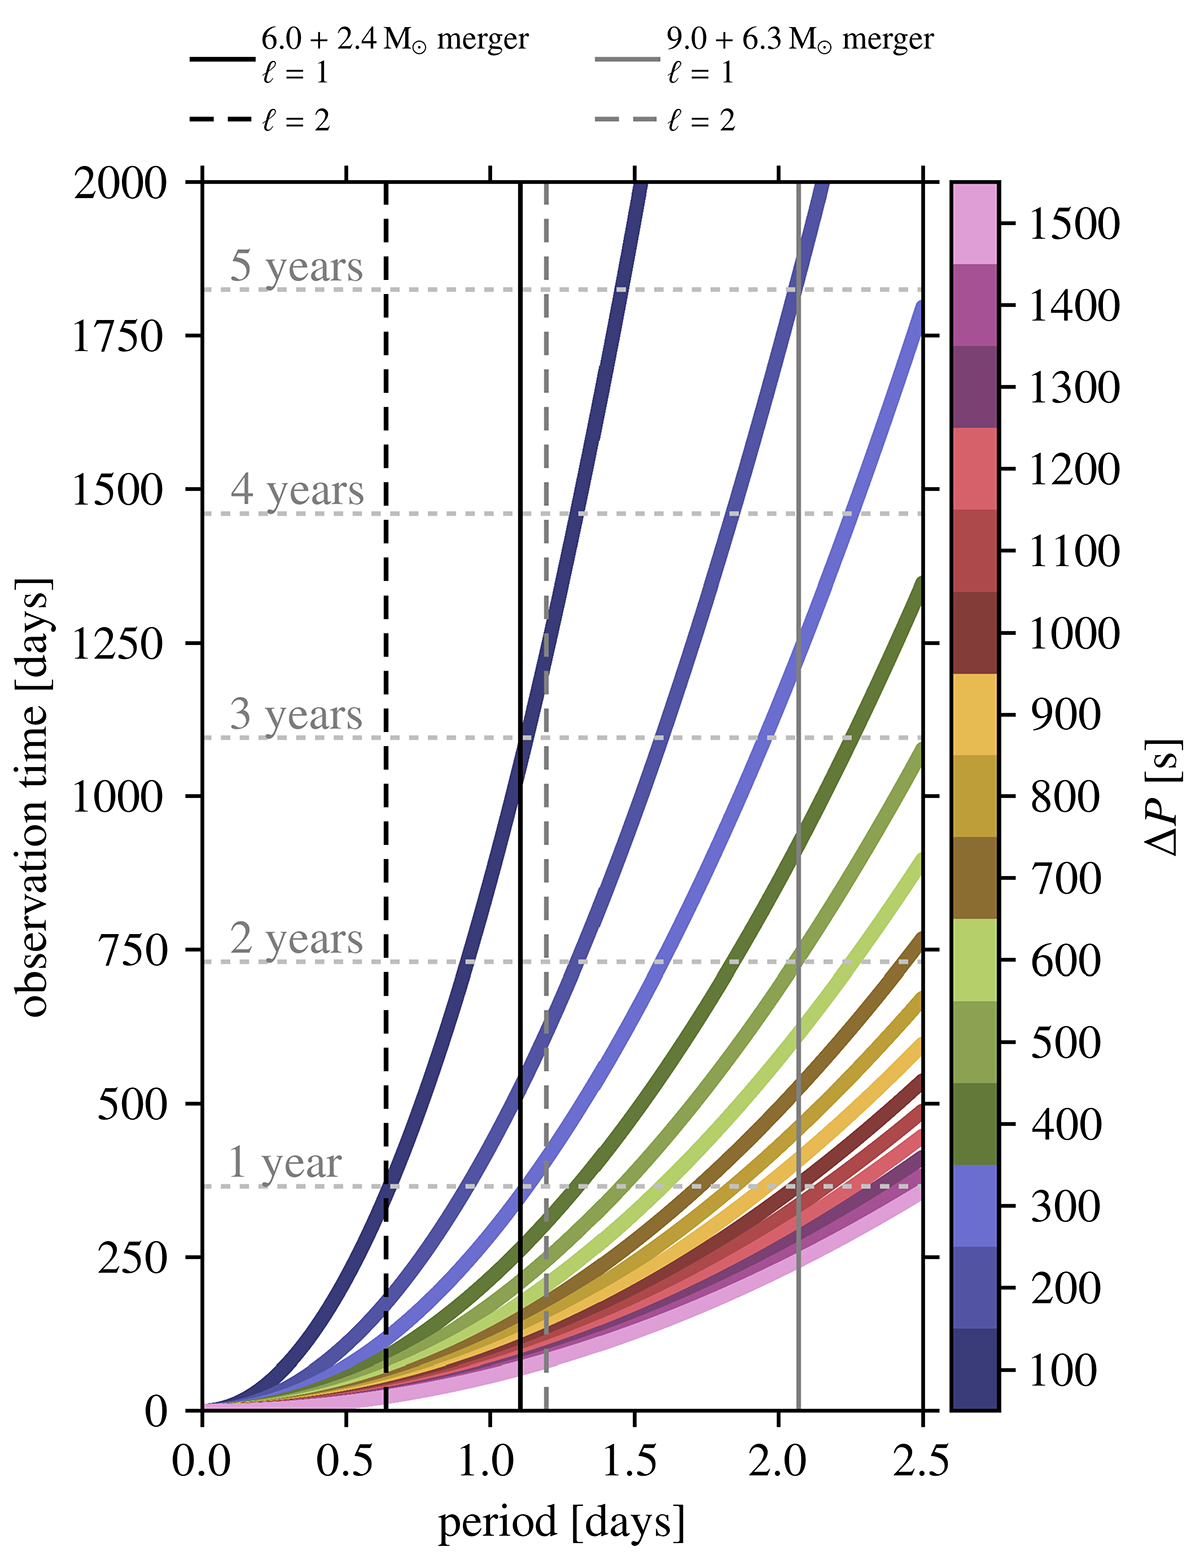
Fig. 13.
Download original image
Observation times required for different period spacings, ΔP, in a period range relevant for the PSPs of merger products in our work. The horizontal dashed silver lines indicate the number of years on the y-axis. The vertical solid and dashed lines show the maximum period (i.e. the period for the mode at npg = −200) for the (ℓ, m) = (1, 0) and (ℓ, m) = (2, 0) modes, respectively, for the non-rotating 6.0 + 2.4 M⊙ (black) and 9.0 + 6.3 M⊙ (grey) merger products (see Figs. 3 and 5).
Current usage metrics show cumulative count of Article Views (full-text article views including HTML views, PDF and ePub downloads, according to the available data) and Abstracts Views on Vision4Press platform.
Data correspond to usage on the plateform after 2015. The current usage metrics is available 48-96 hours after online publication and is updated daily on week days.
Initial download of the metrics may take a while.