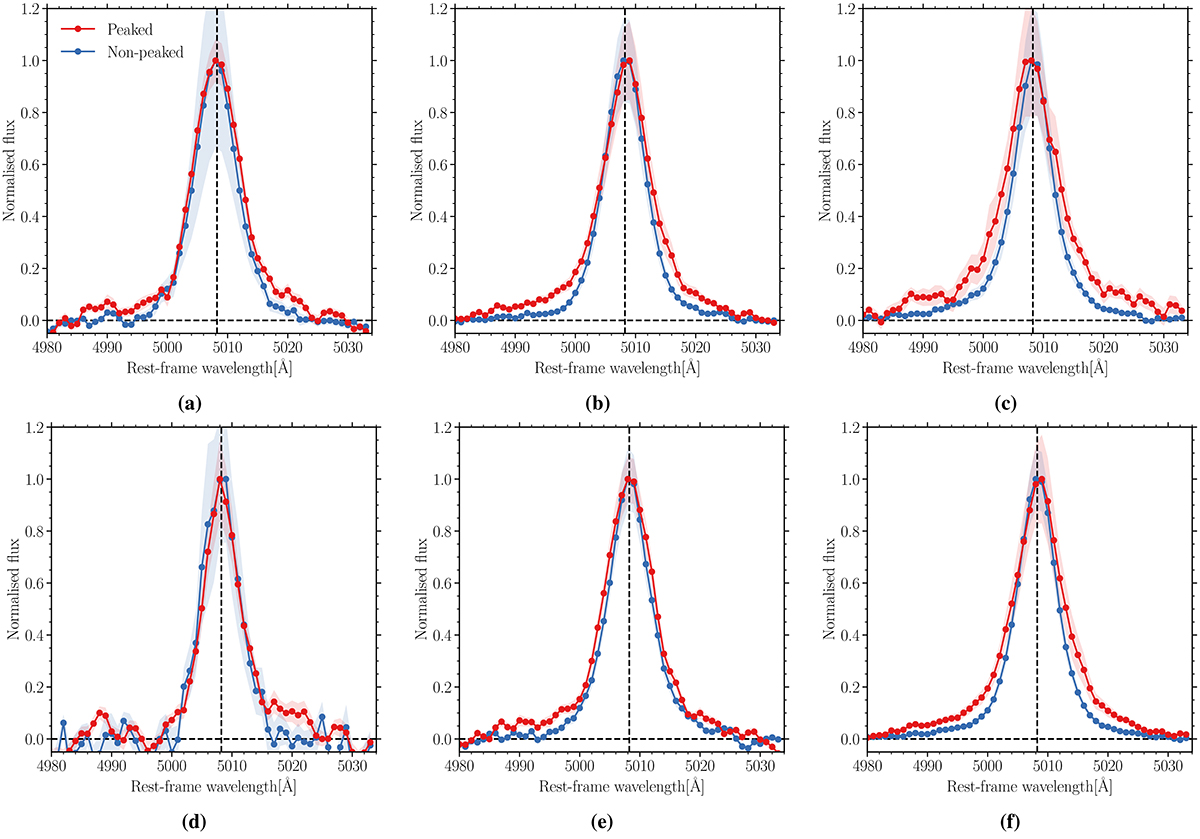
Fig. 9.
Download original image
Stacked [O III] profiles for the peaked and non-peaked spectrum sources in the low redshift sample, while controlling for L1.4 GHz (a−c) and L[O III] (d−f). The shaded regions show the 1σ errors on the stacked profiles, estimated by stacking 1000 bootstrapped samples. The best-fit model parameters for each profile are summarised in Table C.2. (a)−(c) Stacked profiles for PS and NPS sources while controlling for L1.4 GHz: (a) 1023 − 1024 W Hz−1, (b) 1024 − 1025 W Hz−1 and (c) 1025 − 1026 W Hz−1. Stacked profiles for PS and NPS sources while controlling for L[O III]: (d) 1039 − 1040 erg s−1, (e) 1040 − 1041 erg s−1 and (f) 1041 − 1042 erg s−1.
Current usage metrics show cumulative count of Article Views (full-text article views including HTML views, PDF and ePub downloads, according to the available data) and Abstracts Views on Vision4Press platform.
Data correspond to usage on the plateform after 2015. The current usage metrics is available 48-96 hours after online publication and is updated daily on week days.
Initial download of the metrics may take a while.