Fig. 7.
Download original image
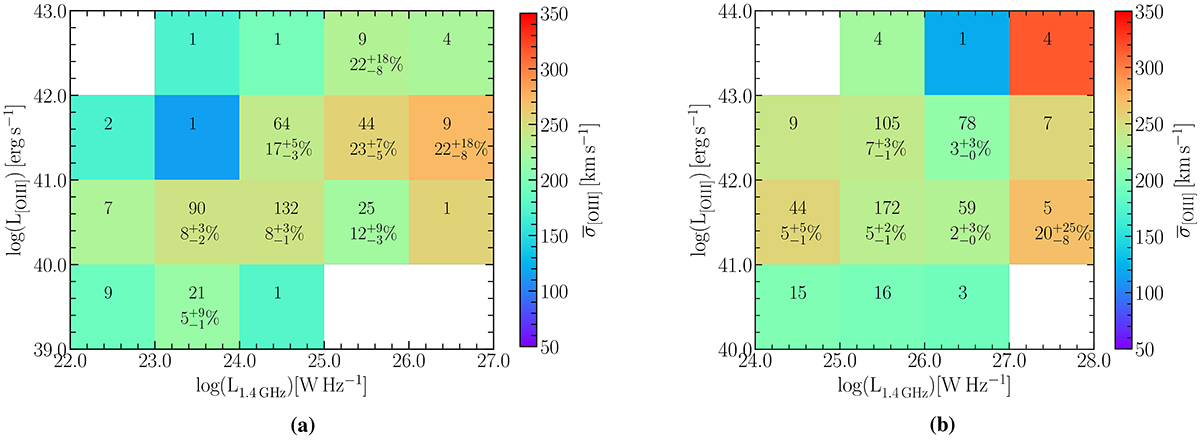
Colour map showing the average ![]() values for the (a) low redshift (0.02 < z < 0.4) and (b) high redshift (0.4 < z < 0.8 sample in bins of L1.4 GHz and L[O III]. The colour of each bin represents the average velocity dispersion in that bin. The number of sources (the bin size) is mentioned at the top of each bin. Fraction of sources with disturbed [O III] are mentioned below the bin size, only for bins that had at least one disturbed source.
values for the (a) low redshift (0.02 < z < 0.4) and (b) high redshift (0.4 < z < 0.8 sample in bins of L1.4 GHz and L[O III]. The colour of each bin represents the average velocity dispersion in that bin. The number of sources (the bin size) is mentioned at the top of each bin. Fraction of sources with disturbed [O III] are mentioned below the bin size, only for bins that had at least one disturbed source.
Current usage metrics show cumulative count of Article Views (full-text article views including HTML views, PDF and ePub downloads, according to the available data) and Abstracts Views on Vision4Press platform.
Data correspond to usage on the plateform after 2015. The current usage metrics is available 48-96 hours after online publication and is updated daily on week days.
Initial download of the metrics may take a while.