Fig. 6.
Download original image
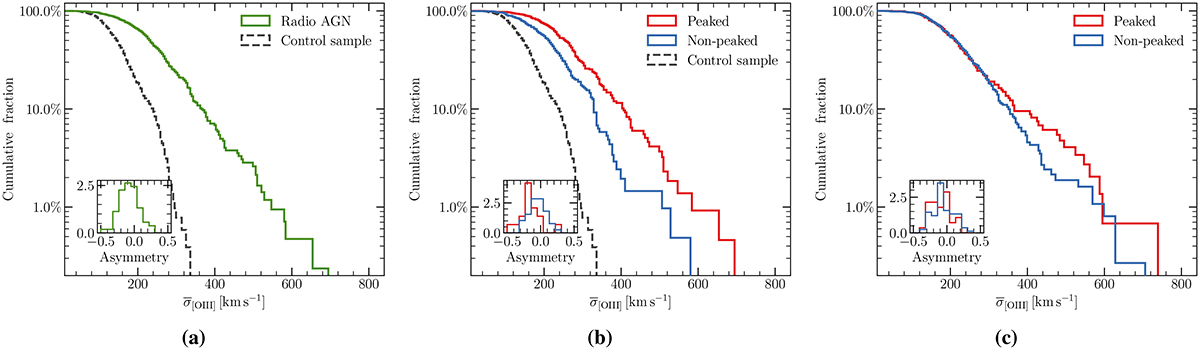
Cumulative distributions of the flux-weighted average [O III] velocity dispersions for [O III] detections. The inset plots show the asymmetry distributions for [O III] profiles with multiple kinematic components in every group. (a): Low redshift (0.02 < z < 0.4) radio AGN sample (PS + NPS) and the control sample of optical AGN up to z ∼ 0.4 from Mullaney et al. (2013), described in Appendix B. (b): Low redshift PS, NPS sources and the control sample. (c): High redshift (0.4 < z < 0.8) PS and NPS sources.
Current usage metrics show cumulative count of Article Views (full-text article views including HTML views, PDF and ePub downloads, according to the available data) and Abstracts Views on Vision4Press platform.
Data correspond to usage on the plateform after 2015. The current usage metrics is available 48-96 hours after online publication and is updated daily on week days.
Initial download of the metrics may take a while.