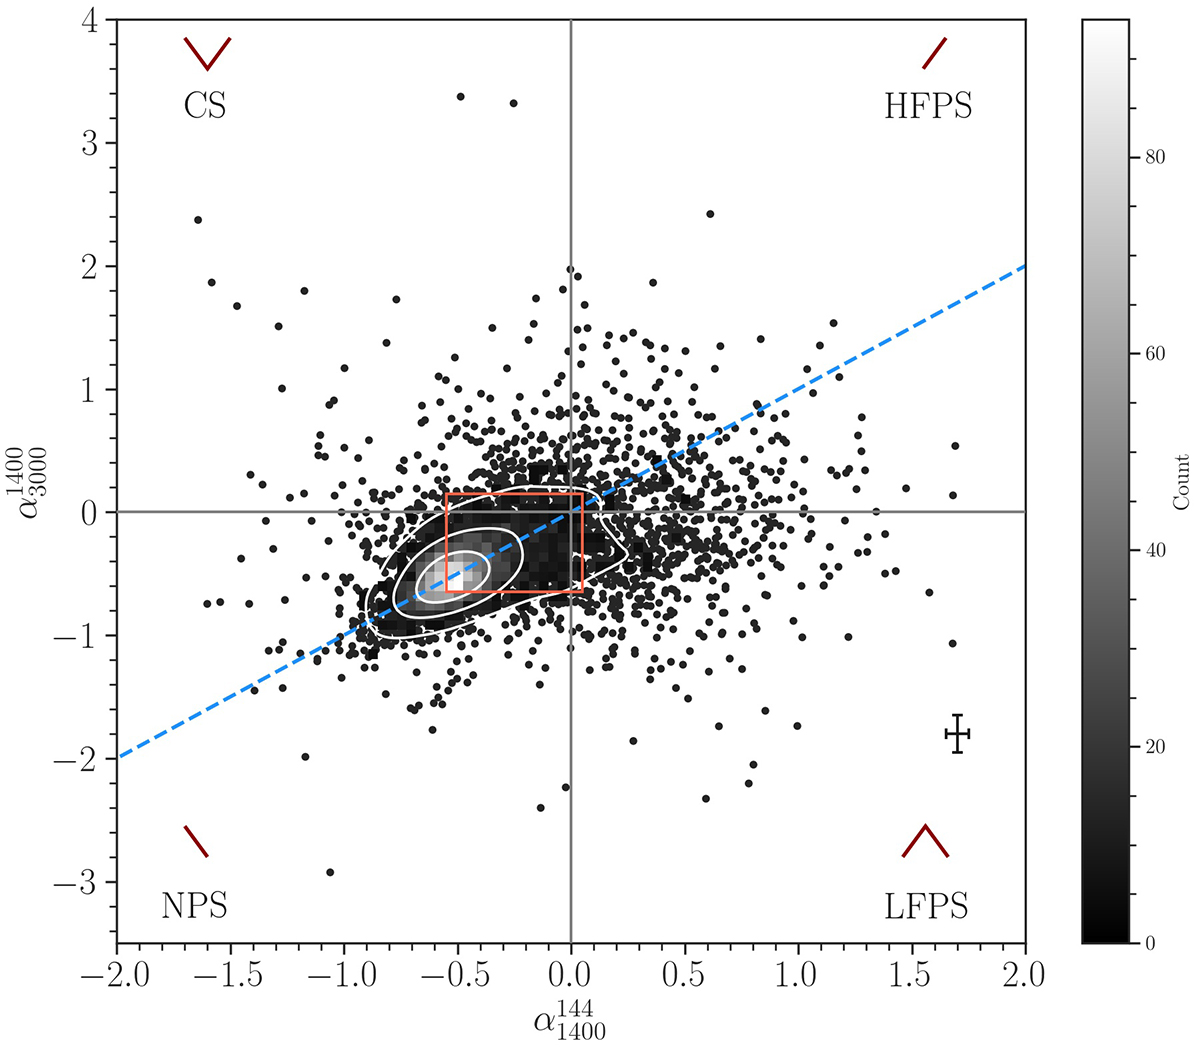
Fig. 3.
Download original image
Colour-colour plot of spectral indices for the radio AGN sample. The different quadrants are labelled with the spectral shapes of the sources lying in that region. The spectral shapes are also shown above the labels. The red square marks the region where flat-spectrum (FS) sources lie. A 1:1 line is shown in blue. While studying the link of spectral shape with gas kinematics, only HFPS, LFPS and NPS sources are considered.
Current usage metrics show cumulative count of Article Views (full-text article views including HTML views, PDF and ePub downloads, according to the available data) and Abstracts Views on Vision4Press platform.
Data correspond to usage on the plateform after 2015. The current usage metrics is available 48-96 hours after online publication and is updated daily on week days.
Initial download of the metrics may take a while.