Fig. C.3.
Download original image
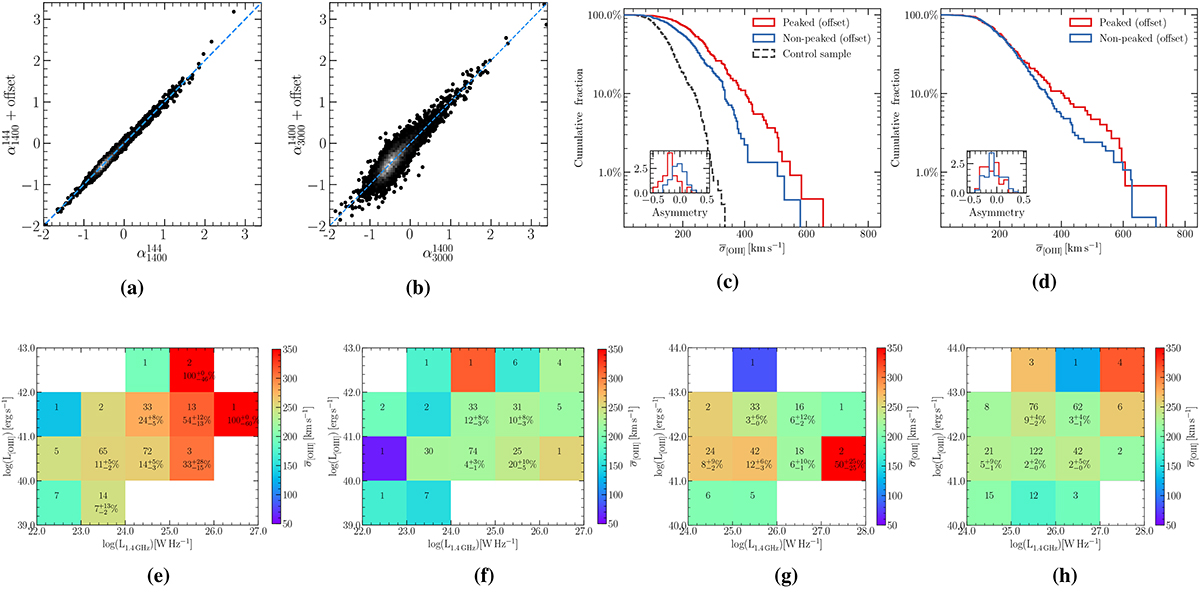
Results for the radio AGN sample after adding offsets to spectral indices. (a)−(b) Comparison of spectral indices before and after adding the offsets described in Sect. 3.1. Cumulative distributions of ![]() after reclassifying sources with the spectral index offset for the (c) low redshift and (d) high redshift sample. Colour maps showing the average
after reclassifying sources with the spectral index offset for the (c) low redshift and (d) high redshift sample. Colour maps showing the average ![]() values and the fraction of disturbed sources in bins of L1.4GHz and L[O III], again after reclassifying sources with the spectral index offset. (e) PS and (f) NPS sources in the low-redshift (0.02 < z < 0.4) sample. (g) PS and (h) NPS sources in the high-redshift (0.4 < z < 0.8) sample.
values and the fraction of disturbed sources in bins of L1.4GHz and L[O III], again after reclassifying sources with the spectral index offset. (e) PS and (f) NPS sources in the low-redshift (0.02 < z < 0.4) sample. (g) PS and (h) NPS sources in the high-redshift (0.4 < z < 0.8) sample.
Current usage metrics show cumulative count of Article Views (full-text article views including HTML views, PDF and ePub downloads, according to the available data) and Abstracts Views on Vision4Press platform.
Data correspond to usage on the plateform after 2015. The current usage metrics is available 48-96 hours after online publication and is updated daily on week days.
Initial download of the metrics may take a while.