Fig. 13.
Download original image
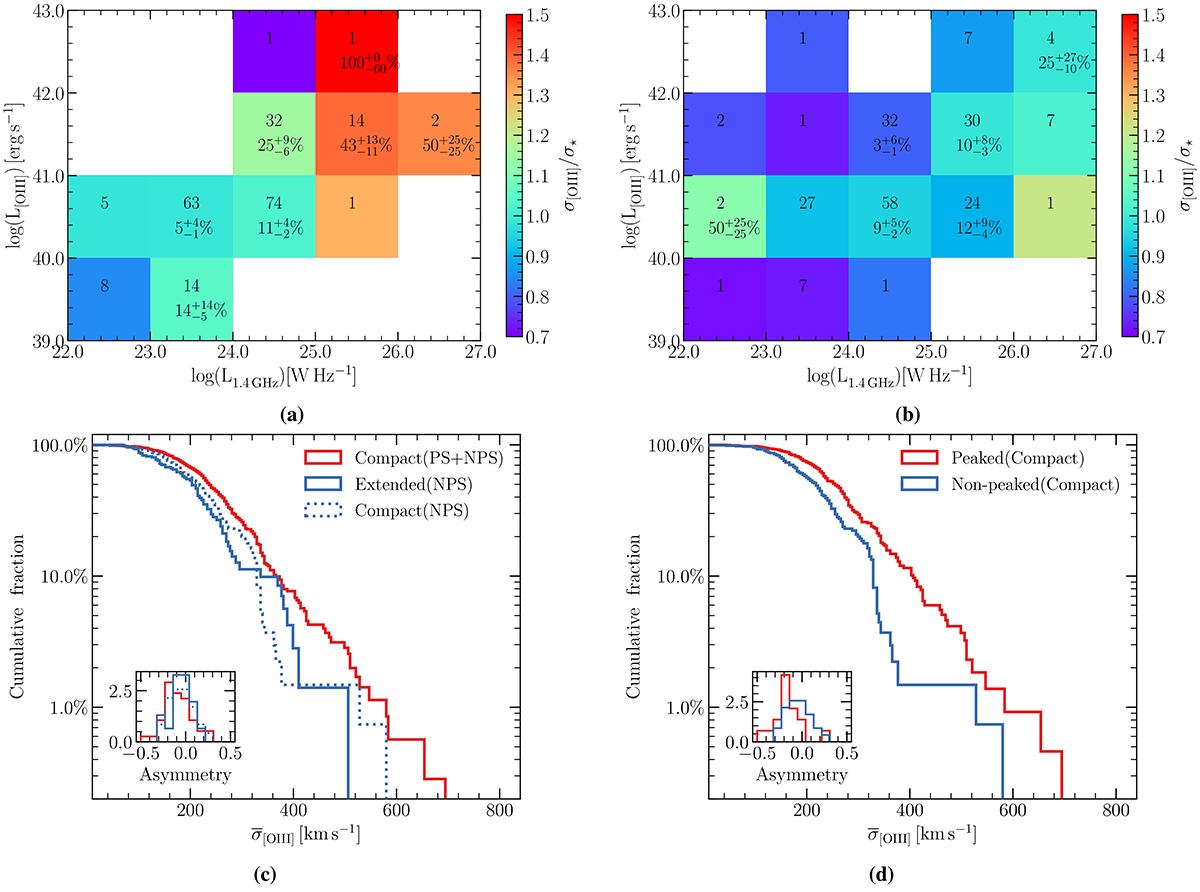
Distributions of σO III]/σ⋆ and ![]() . Colour map showing the average σO III]/σ⋆ values for (a) peaked and (b) non-peaked sources in the low redshift (0.02 < z < 0.4) sample, in bins of L1.4 GHz and L[O III], similar to Fig. 7a. (c) Cumulative distributions of the average [O III] velocity dispersions. Comparison for compact (< 3″) and extended (> 3″) sources according to FIRST sizes in the low redshift sample. We also plot the compact NPS sources for comparison. The inset plot shows the asymmetry distributions for the [O III] profiles with multiple kinematic components. (d) Cumulative distributions for low redshift PS and NPS sources that are compact in FIRST.
. Colour map showing the average σO III]/σ⋆ values for (a) peaked and (b) non-peaked sources in the low redshift (0.02 < z < 0.4) sample, in bins of L1.4 GHz and L[O III], similar to Fig. 7a. (c) Cumulative distributions of the average [O III] velocity dispersions. Comparison for compact (< 3″) and extended (> 3″) sources according to FIRST sizes in the low redshift sample. We also plot the compact NPS sources for comparison. The inset plot shows the asymmetry distributions for the [O III] profiles with multiple kinematic components. (d) Cumulative distributions for low redshift PS and NPS sources that are compact in FIRST.
Current usage metrics show cumulative count of Article Views (full-text article views including HTML views, PDF and ePub downloads, according to the available data) and Abstracts Views on Vision4Press platform.
Data correspond to usage on the plateform after 2015. The current usage metrics is available 48-96 hours after online publication and is updated daily on week days.
Initial download of the metrics may take a while.