Fig. 11.
Download original image
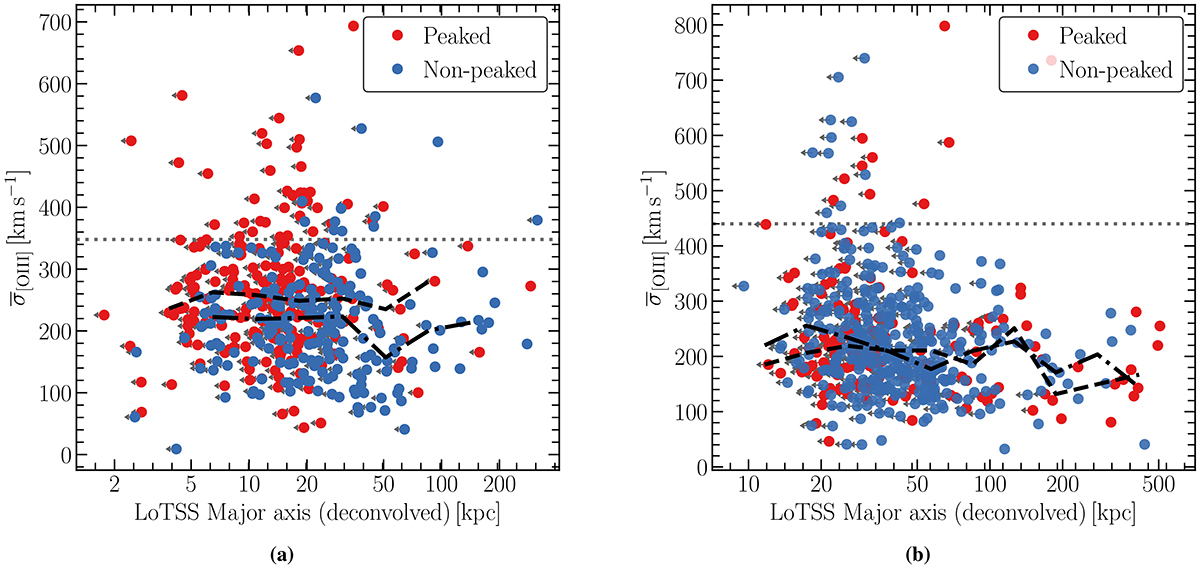
LoTSS major axis physical sizes (deconvolved) vs ![]() for the (a) low redshift (0.02 < z < 0.4) and (b) high redshift (0.4 < z < 0.8) sample. The different colours show the peaked and non-peaked spectrum sources. Sources unresolved in LoTSS are marked with a horizontal arrow since the sizes are upper limits in these cases. Dashed and dashdotted lines show the median values for the peaked and non-peaked sources respectively, in bins of major axis sizes. The dotted horizontal line marks the
for the (a) low redshift (0.02 < z < 0.4) and (b) high redshift (0.4 < z < 0.8) sample. The different colours show the peaked and non-peaked spectrum sources. Sources unresolved in LoTSS are marked with a horizontal arrow since the sizes are upper limits in these cases. Dashed and dashdotted lines show the median values for the peaked and non-peaked sources respectively, in bins of major axis sizes. The dotted horizontal line marks the ![]() threshold for classifying the [O III] in a source as disturbed.
threshold for classifying the [O III] in a source as disturbed.
Current usage metrics show cumulative count of Article Views (full-text article views including HTML views, PDF and ePub downloads, according to the available data) and Abstracts Views on Vision4Press platform.
Data correspond to usage on the plateform after 2015. The current usage metrics is available 48-96 hours after online publication and is updated daily on week days.
Initial download of the metrics may take a while.