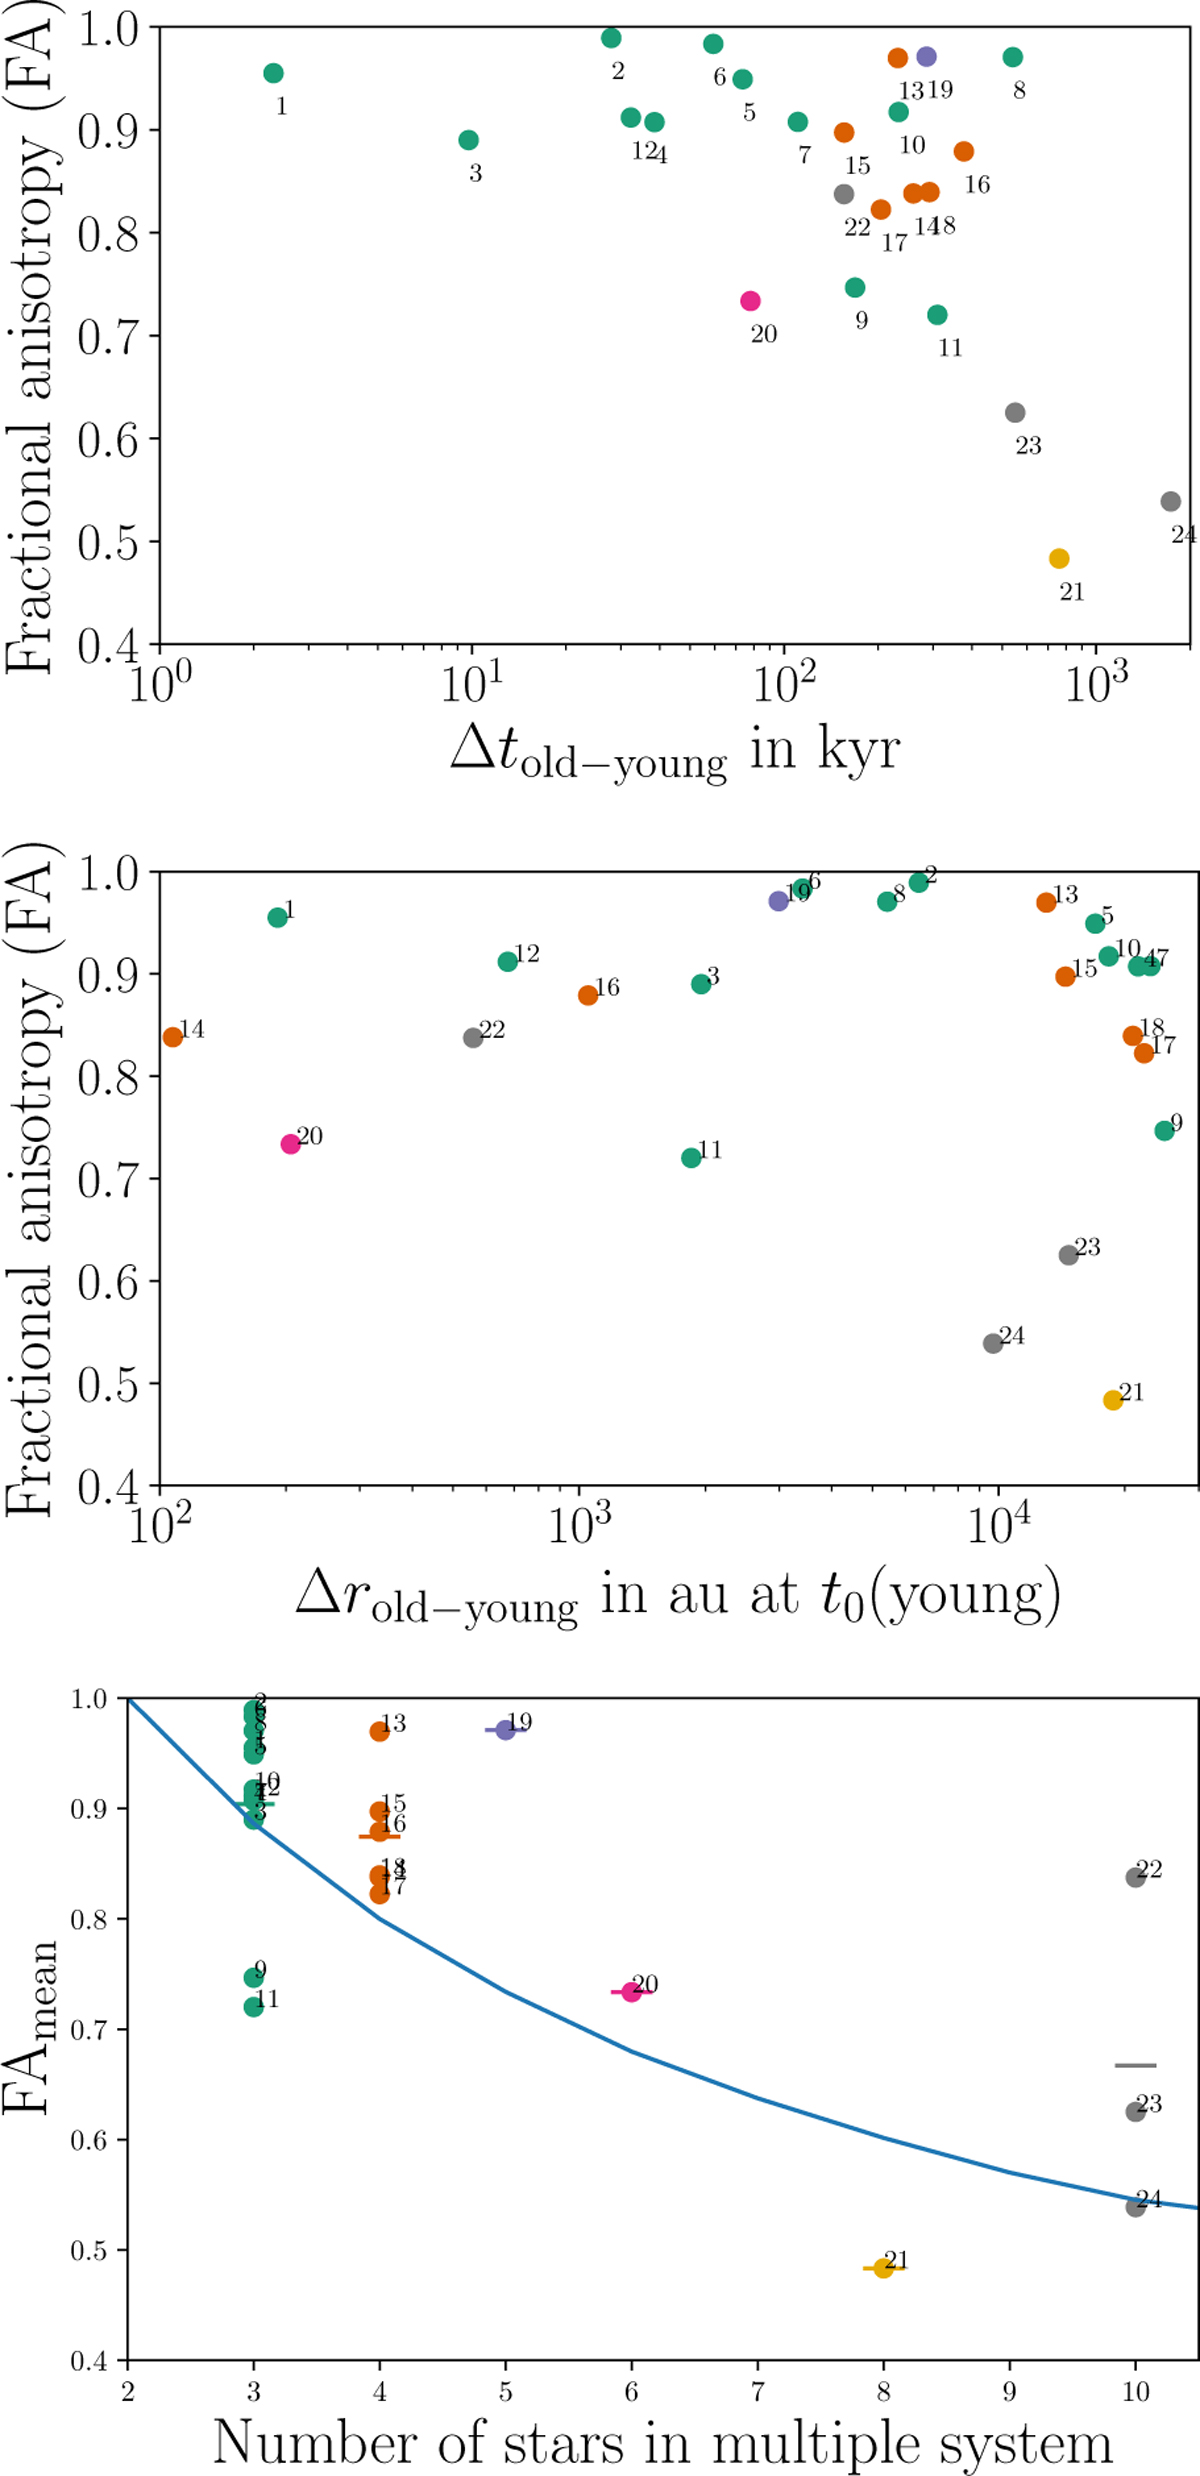
Fig. 9
Download original image
Fractional anisotropy of multiple systems at t ≈ 1.91 Myr after formation of the first star in the simulation. Top panel: fractional anisotropy (FA) versus difference between formation time of oldest and youngest member. Middle panel: FA versus distance between the oldest and youngest member at the formation time of the youngest member. Bottom panel: FA versus number of stars in the corresponding system. The points show the values of the systems and the horizontal bars show the averages for systems with the same number stars. The blue line shows the expectation value for an entirely random distribution computed with 10000 iterations per number of stars using the random sample routine of numpy (Harris et al. 2020). At this point in time, there are 12 triple systems (green points), 6 systems with 4 stars (orange points), 1 system with 5 stars (blue-purple point), 1 system with 6 stars (violet points), 1 system with 8 stars (yellow point), and 3 systems with 10 stars (gray points).
Current usage metrics show cumulative count of Article Views (full-text article views including HTML views, PDF and ePub downloads, according to the available data) and Abstracts Views on Vision4Press platform.
Data correspond to usage on the plateform after 2015. The current usage metrics is available 48-96 hours after online publication and is updated daily on week days.
Initial download of the metrics may take a while.