Fig. 8
Download original image
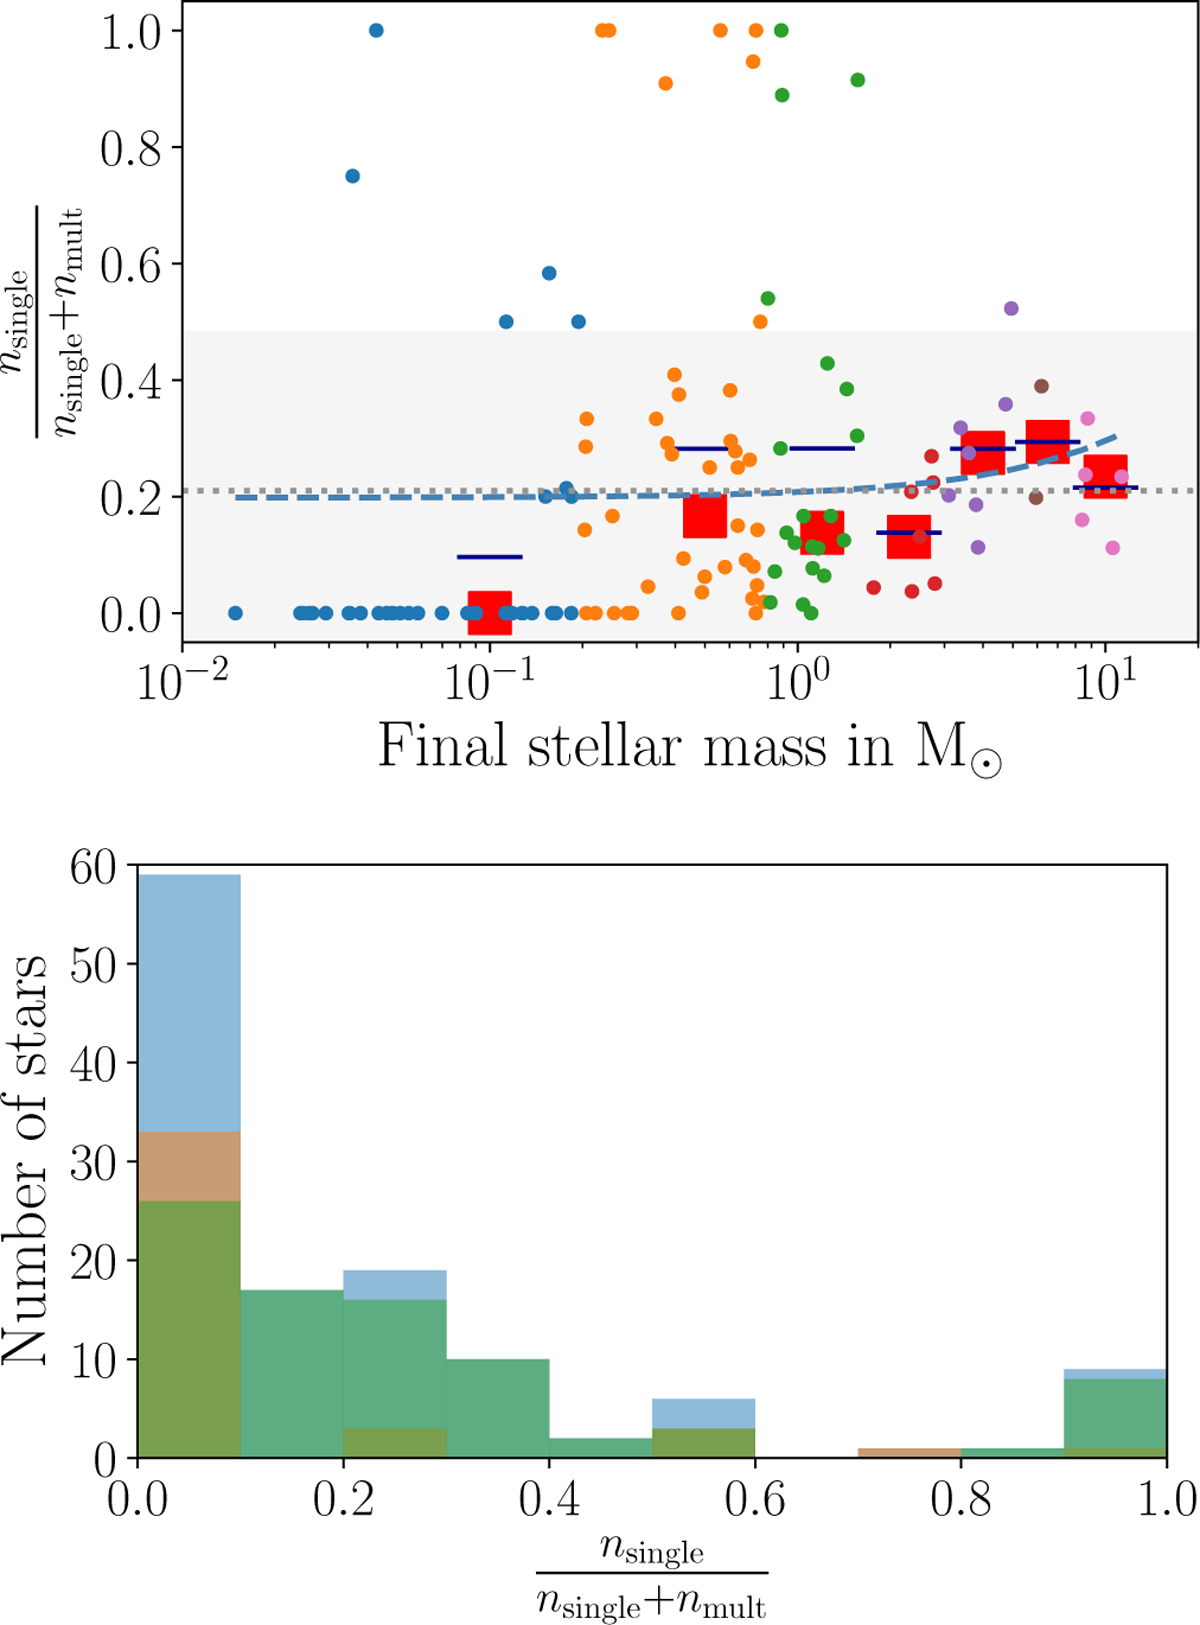
Fraction of output snapshots when individual stars accrete mass as isolated single stars without any neighboring star within a radial distance of 2 × 10⁴ au and total number of output snapshots when accretion is ongoing ![]() over final stellar mass (top). Each filled circle represents one of the 124 stars that have reached an age of at least 974 kyr. Light blue corresponds to 41 stars with M* < 0.2 M⊙, orange to 41 stars in the range 0.2 M⊙ ≤ M* < 0.8 M⊙, green to 21 stars in the range 0.8 M⊙ ≤ M* < 1.6 M⊙, dark-red to 7 stars in the range 1.6 M⊙ ≤ M* < 3 M⊙, purple to 7 stars in the range 3 M⊙ ≤ M* < 5 M⊙, brown to 2 stars in the range 5 M⊙ ≤ M* < 8 M⊙, and violet to 5 stars with M* > 8 M⊙. The red squares correspond to the median per bin, the dark-blue horizontal lines show the mean per bin. The grey dotted line shows the mean value of all stars and the light-grey line is the corresponding standard deviation. The light-blue dashed line shows the line fit based on all points using numpy’s polyfit function. Bottom panel gives the histogram of
over final stellar mass (top). Each filled circle represents one of the 124 stars that have reached an age of at least 974 kyr. Light blue corresponds to 41 stars with M* < 0.2 M⊙, orange to 41 stars in the range 0.2 M⊙ ≤ M* < 0.8 M⊙, green to 21 stars in the range 0.8 M⊙ ≤ M* < 1.6 M⊙, dark-red to 7 stars in the range 1.6 M⊙ ≤ M* < 3 M⊙, purple to 7 stars in the range 3 M⊙ ≤ M* < 5 M⊙, brown to 2 stars in the range 5 M⊙ ≤ M* < 8 M⊙, and violet to 5 stars with M* > 8 M⊙. The red squares correspond to the median per bin, the dark-blue horizontal lines show the mean per bin. The grey dotted line shows the mean value of all stars and the light-grey line is the corresponding standard deviation. The light-blue dashed line shows the line fit based on all points using numpy’s polyfit function. Bottom panel gives the histogram of ![]() for all 124 stars that have reached at least 974 kyr of age (light blue bars), 41 stars with a final stellar mass of M*,final < 0.2 M⊙ (brown-orange bars) and 83 stars with M*,final > 0.2 M⊙ (green bars).
for all 124 stars that have reached at least 974 kyr of age (light blue bars), 41 stars with a final stellar mass of M*,final < 0.2 M⊙ (brown-orange bars) and 83 stars with M*,final > 0.2 M⊙ (green bars).
Current usage metrics show cumulative count of Article Views (full-text article views including HTML views, PDF and ePub downloads, according to the available data) and Abstracts Views on Vision4Press platform.
Data correspond to usage on the plateform after 2015. The current usage metrics is available 48-96 hours after online publication and is updated daily on week days.
Initial download of the metrics may take a while.