Open Access
Fig. 7
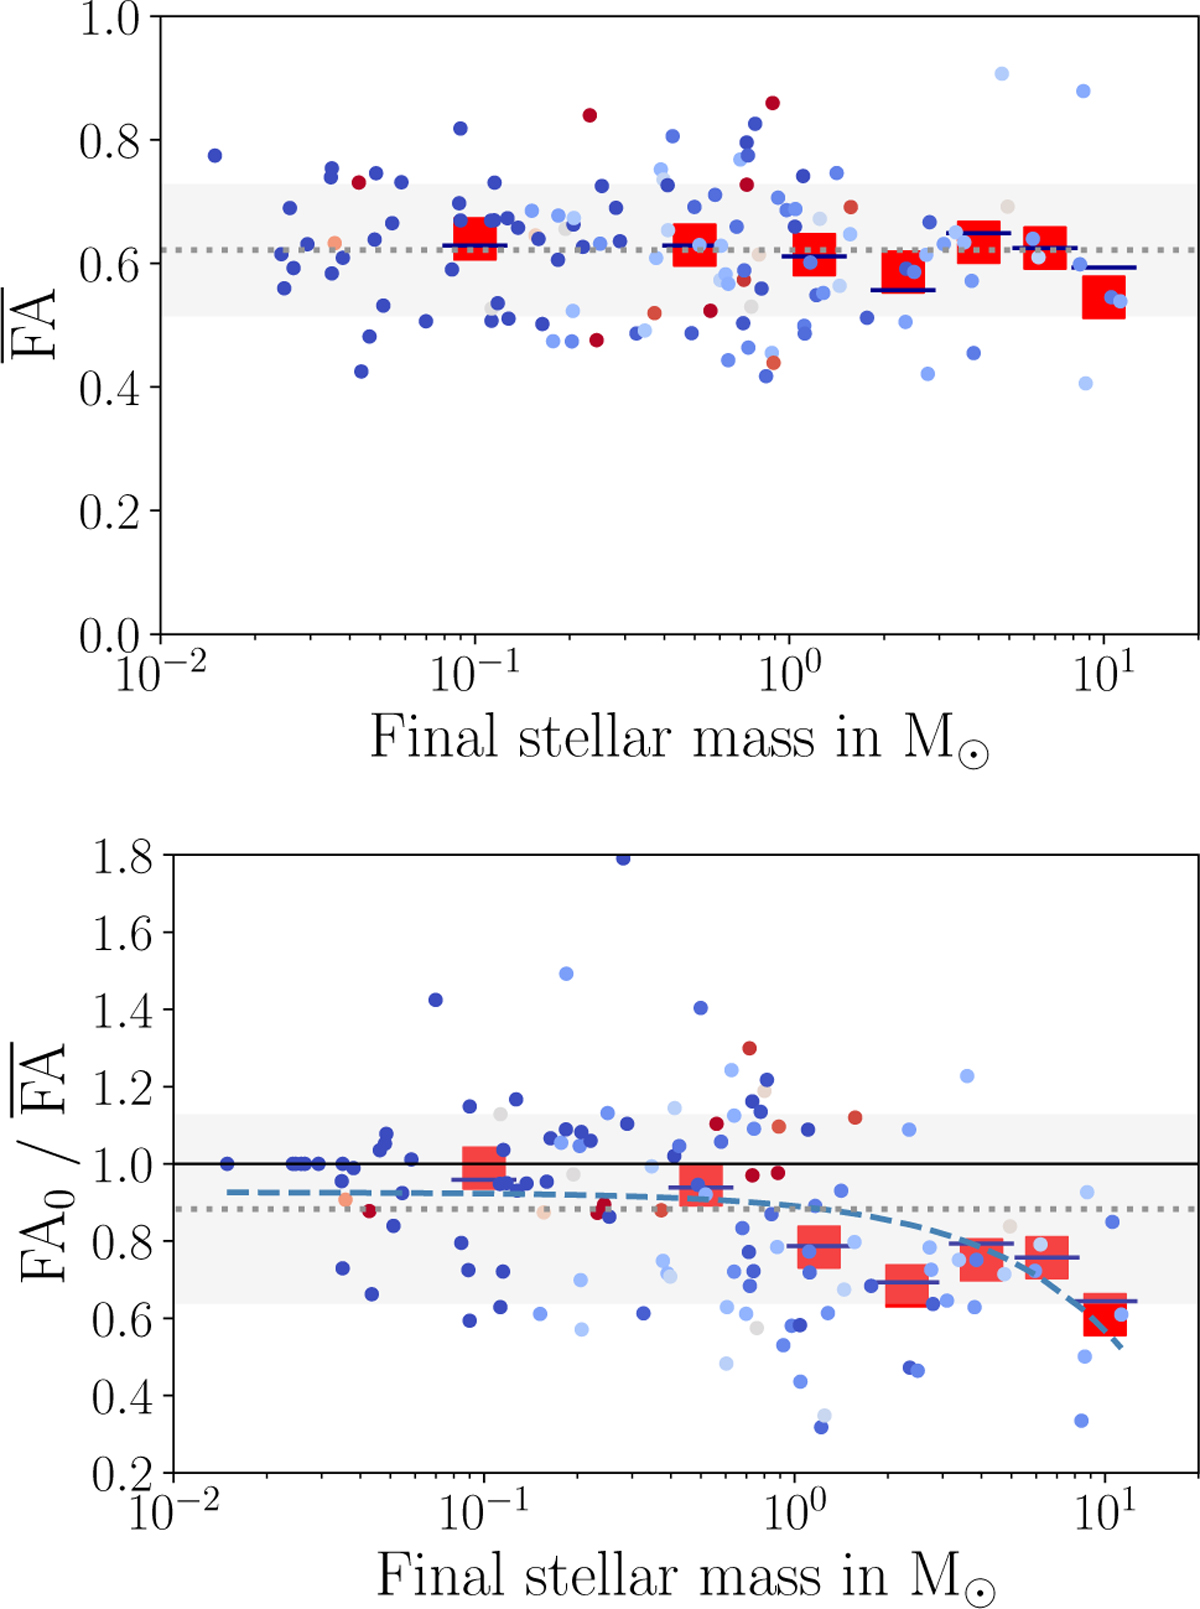
Download original image
Same as Figs. 5 and 6 except that dots of individual stars are colored according to their evolution as a single star or as part of a multiple system, shown in the top and bottom panels. The redder (bluer) the dot, the higher is the fraction of time that the star evolved as a single star (multiple system) while accreting.
Current usage metrics show cumulative count of Article Views (full-text article views including HTML views, PDF and ePub downloads, according to the available data) and Abstracts Views on Vision4Press platform.
Data correspond to usage on the plateform after 2015. The current usage metrics is available 48-96 hours after online publication and is updated daily on week days.
Initial download of the metrics may take a while.