Fig. 5
Download original image
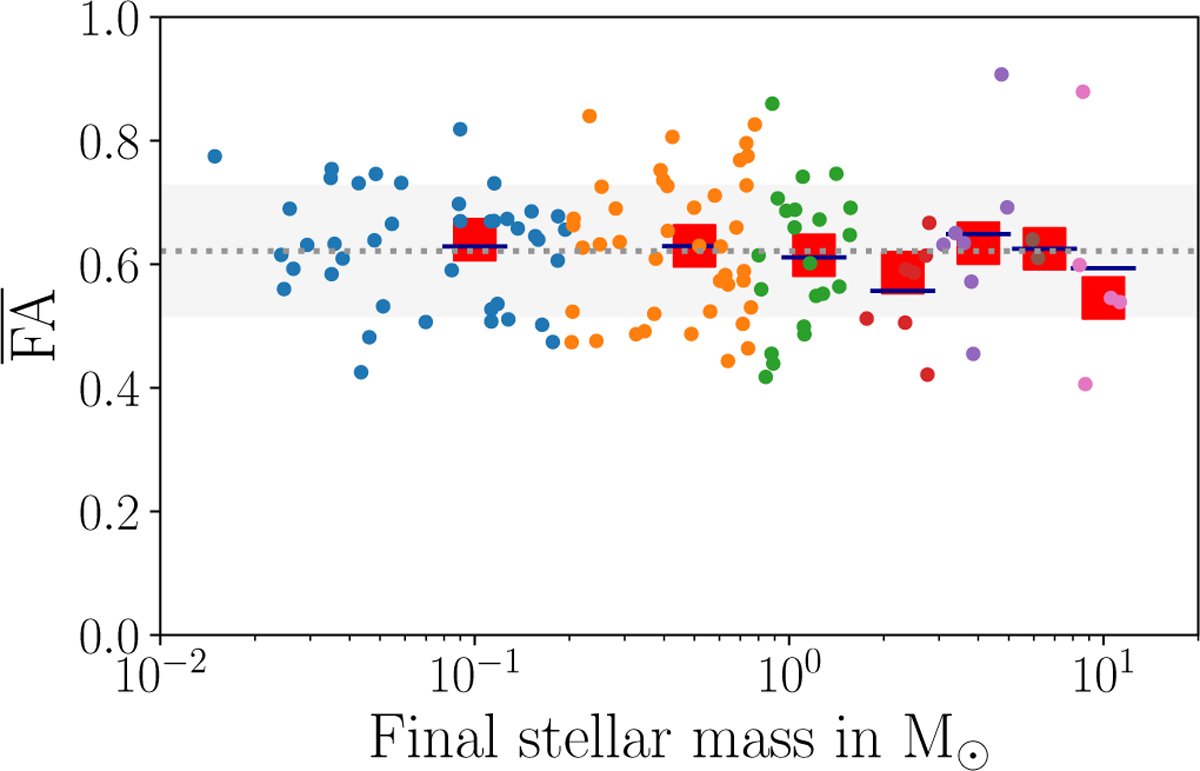
FA of the first Δmp = 0.05 M⊙ with respect to the average FA of the accreting material over the mass at the end of the simulation. The dots show ![]() of all the 124 stars that have reached an age of at least 974 kyr. The efficiency factor of sink accretion is set to 50% to account for the mass loss via outflow. That means the stellar mass only increases by 0.025 M⊙ for accretion of 0.05 M⊙. Light blue corresponds to 41 stars with M* < 0.2 M⊙, orange to 41 stars in the range 0.2 M⊙ ≤ M* < 0.8 M⊙, green to 21 stars in the range 0.8 M⊙ ≤ M* < 1.6 M⊙, dark-red to 7 stars in the range 1.6 M⊙ ≤ M* < 3 M⊙, purple to 7 stars in the range 3 M⊙ ≤ M* < 5 M⊙, brown to 2 stars in the range 5 M⊙ ≤ M* < 8 M⊙, and violet to 5 stars with M* > 8 M⊙. The red squares correspond to the median per bin, the dark-blue horizontal lines show the mean per bin. The grey dotted line shows the mean value of all stars and the light-grey area marks the corresponding standard deviation.
of all the 124 stars that have reached an age of at least 974 kyr. The efficiency factor of sink accretion is set to 50% to account for the mass loss via outflow. That means the stellar mass only increases by 0.025 M⊙ for accretion of 0.05 M⊙. Light blue corresponds to 41 stars with M* < 0.2 M⊙, orange to 41 stars in the range 0.2 M⊙ ≤ M* < 0.8 M⊙, green to 21 stars in the range 0.8 M⊙ ≤ M* < 1.6 M⊙, dark-red to 7 stars in the range 1.6 M⊙ ≤ M* < 3 M⊙, purple to 7 stars in the range 3 M⊙ ≤ M* < 5 M⊙, brown to 2 stars in the range 5 M⊙ ≤ M* < 8 M⊙, and violet to 5 stars with M* > 8 M⊙. The red squares correspond to the median per bin, the dark-blue horizontal lines show the mean per bin. The grey dotted line shows the mean value of all stars and the light-grey area marks the corresponding standard deviation.
Current usage metrics show cumulative count of Article Views (full-text article views including HTML views, PDF and ePub downloads, according to the available data) and Abstracts Views on Vision4Press platform.
Data correspond to usage on the plateform after 2015. The current usage metrics is available 48-96 hours after online publication and is updated daily on week days.
Initial download of the metrics may take a while.