Fig. 4
Download original image
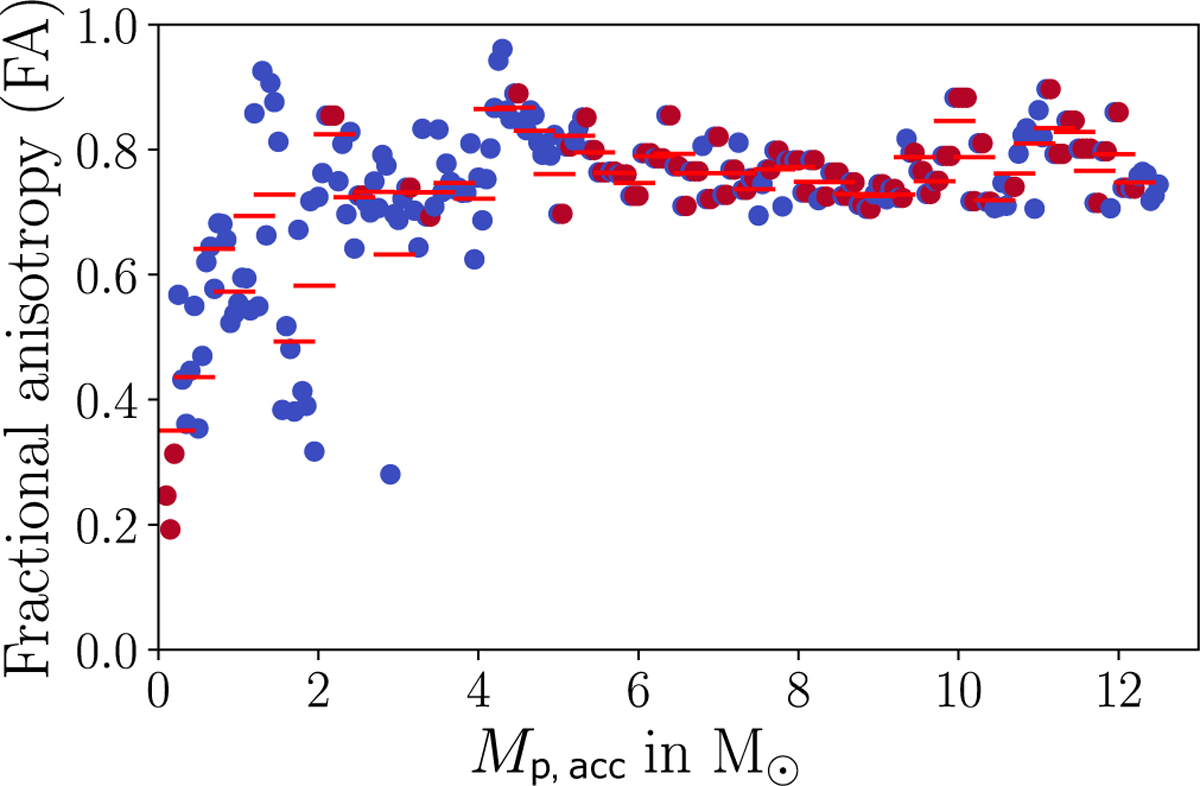
Fractional anisotropy (FA) of the accreting material for a star in the simulation. Each dot represents FA for accrual of a mass bin of 0.05 M⊙. Blue colors mean that the star was part of a multiple system while accreting the corresponding mass, red dots mean that it accreted its material as a single star. The red horizontal lines represent the average of FA over five mass bins, i.e., over 0.25 M⊙.
Current usage metrics show cumulative count of Article Views (full-text article views including HTML views, PDF and ePub downloads, according to the available data) and Abstracts Views on Vision4Press platform.
Data correspond to usage on the plateform after 2015. The current usage metrics is available 48-96 hours after online publication and is updated daily on week days.
Initial download of the metrics may take a while.