Fig. 1
Download original image
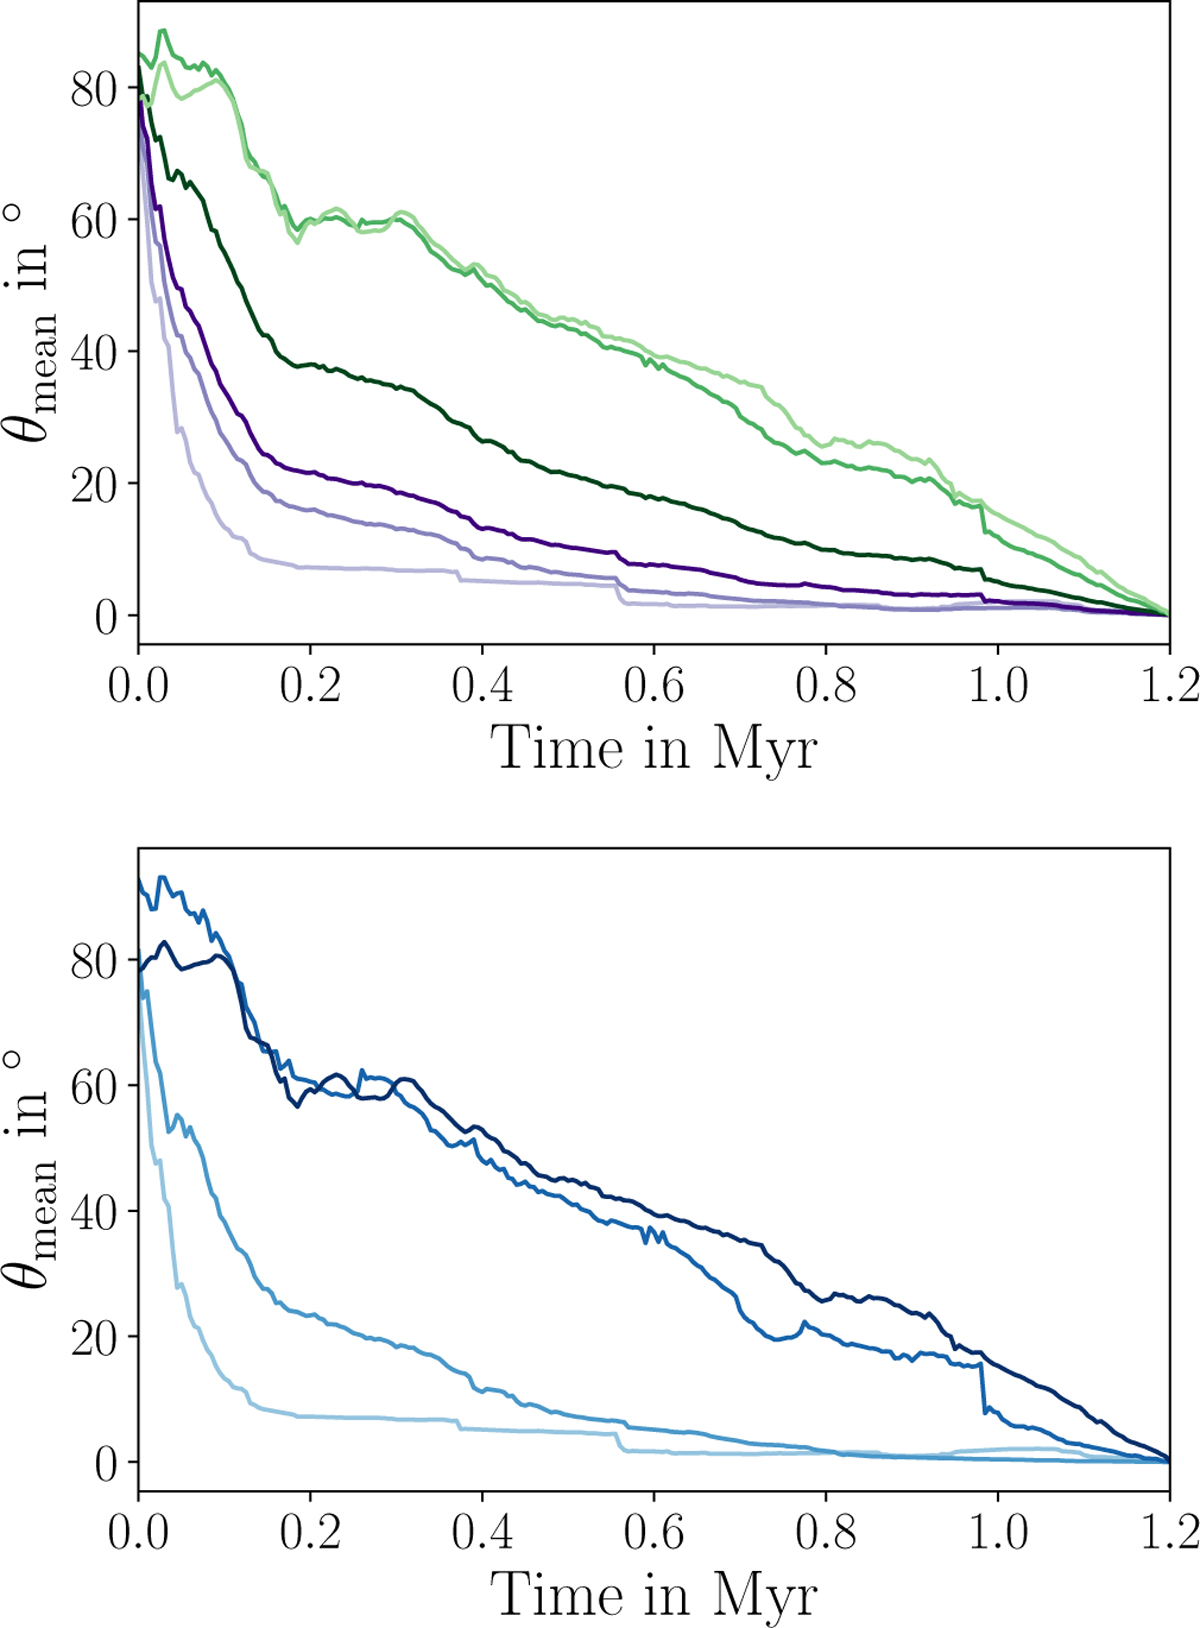
Evolution of average angle θ of star-disk spin with respect to the spin after t = 1.2 Myr (upper panel) and t = 0.5 Myr (lower panel) for various upper and lower limits of the stellar masses. The average angle is computed based on stars that have an age of more than 1.2 Myr at the end of the simulation. Upper panel: Mean average relative angle of orientation with respect to the orientation at t = 1.2 Myr for stars with masses of M*(1.2 Myr) less than 0.2 M⊙, 1 M⊙, and 2 M⊙, shown as light to dark purple lines. Dark to light green lines mark the mean average angle of orientation with respect to the orientation at t = 1.2 Myr for stars with final masses greater than 0.2 M⊙, 1 M⊙, and 2 M⊙. Lower panel: Average mean angle of orientation with respect to the orientation at t = 1.2 Myr for stars with masses in the mass ranges of M* (1.2 Myr) < 0.2 M⊙, 0.2 M⊙ < M*(1.2 Myr) < 1 M⊙, 1 M⊙ < M*(1.2 Myr) < 2 M⊙, and M*(1.2Myr) > 2 M⊙, shown as light to dark blue lines. The upper panel can be directly compared with the results presented in Kuffmeier et al. (2023), while the evolution for mass ranges shown in lower panel is arguably more helpful for comparison with observations of various stellar types.
Current usage metrics show cumulative count of Article Views (full-text article views including HTML views, PDF and ePub downloads, according to the available data) and Abstracts Views on Vision4Press platform.
Data correspond to usage on the plateform after 2015. The current usage metrics is available 48-96 hours after online publication and is updated daily on week days.
Initial download of the metrics may take a while.