Fig. 5.
Download original image
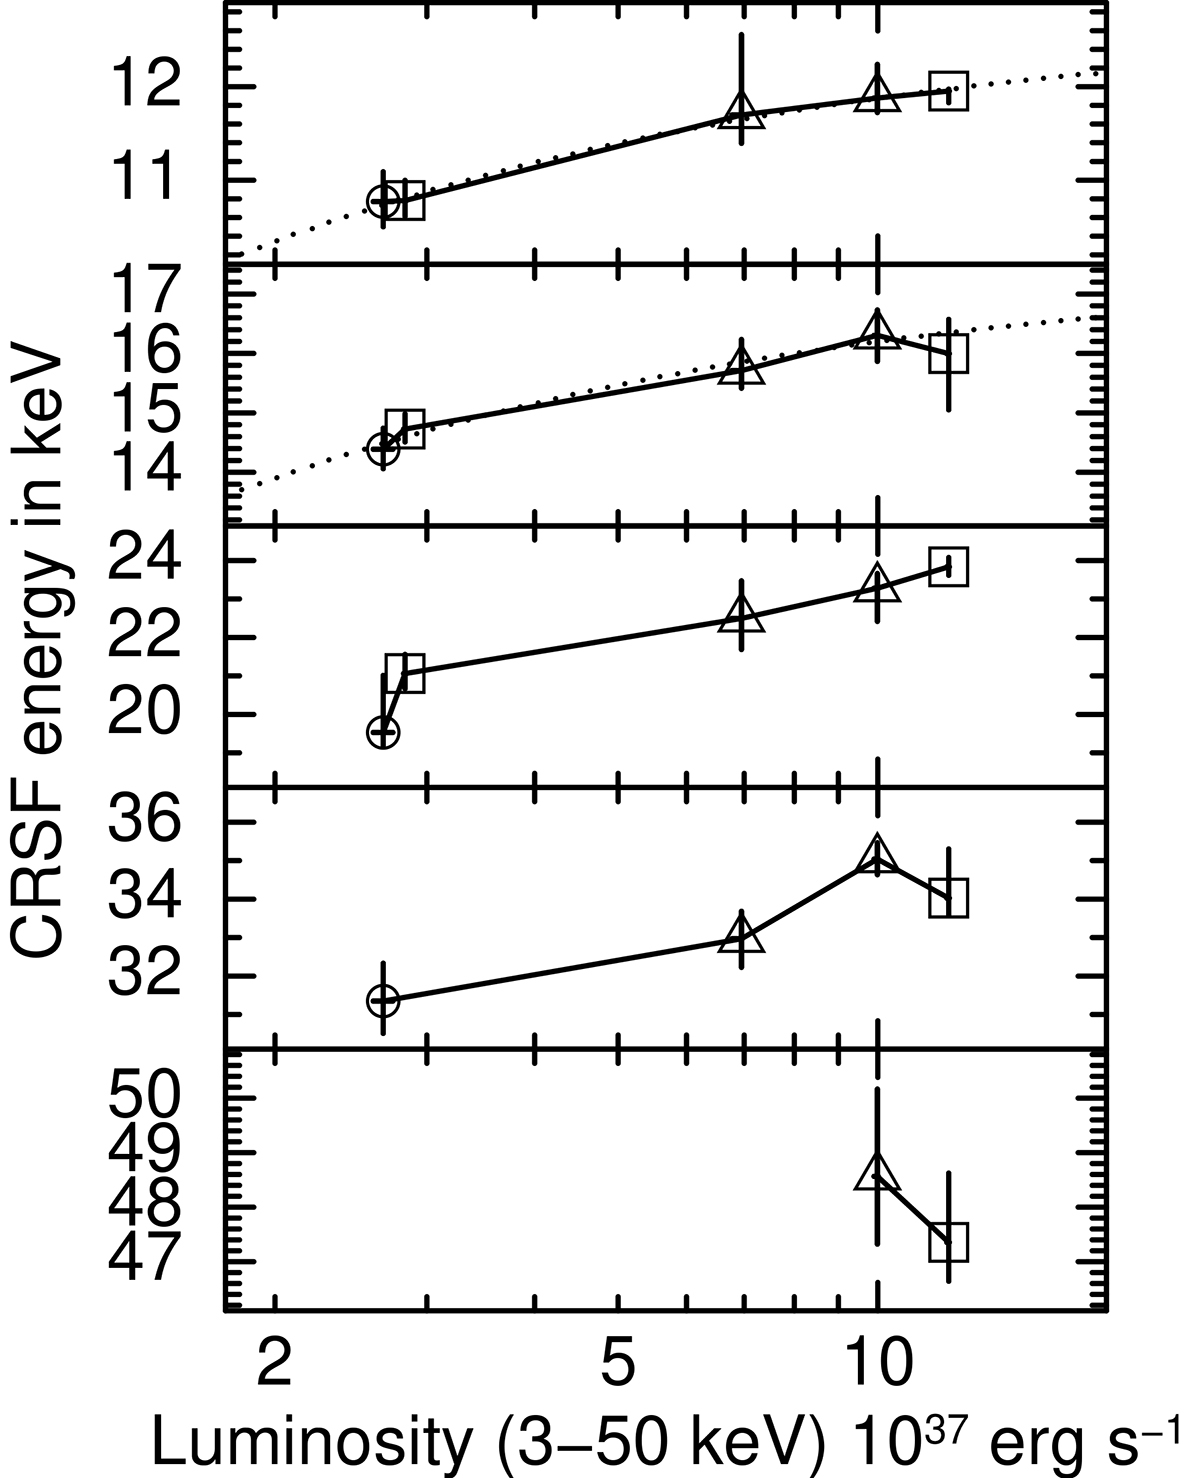
Variation in the line energies of different cyclotron lines with 3–50 keV luminosity of the source. Circles correspond to the 2011 outburst (Iyer et al. 2015), triangles correspond to the 2015 outburst, and square points represent the results from the current work. The evolution of the 12, 16, 24, 34, and 48 keV are shown in different panels from top to bottom. The dotted lines in the top two panels show the predicted variation in the cyclotron line (Ecyc) and X-ray luminosity (LX) according to a collisionless shock model.
Current usage metrics show cumulative count of Article Views (full-text article views including HTML views, PDF and ePub downloads, according to the available data) and Abstracts Views on Vision4Press platform.
Data correspond to usage on the plateform after 2015. The current usage metrics is available 48-96 hours after online publication and is updated daily on week days.
Initial download of the metrics may take a while.