Open Access
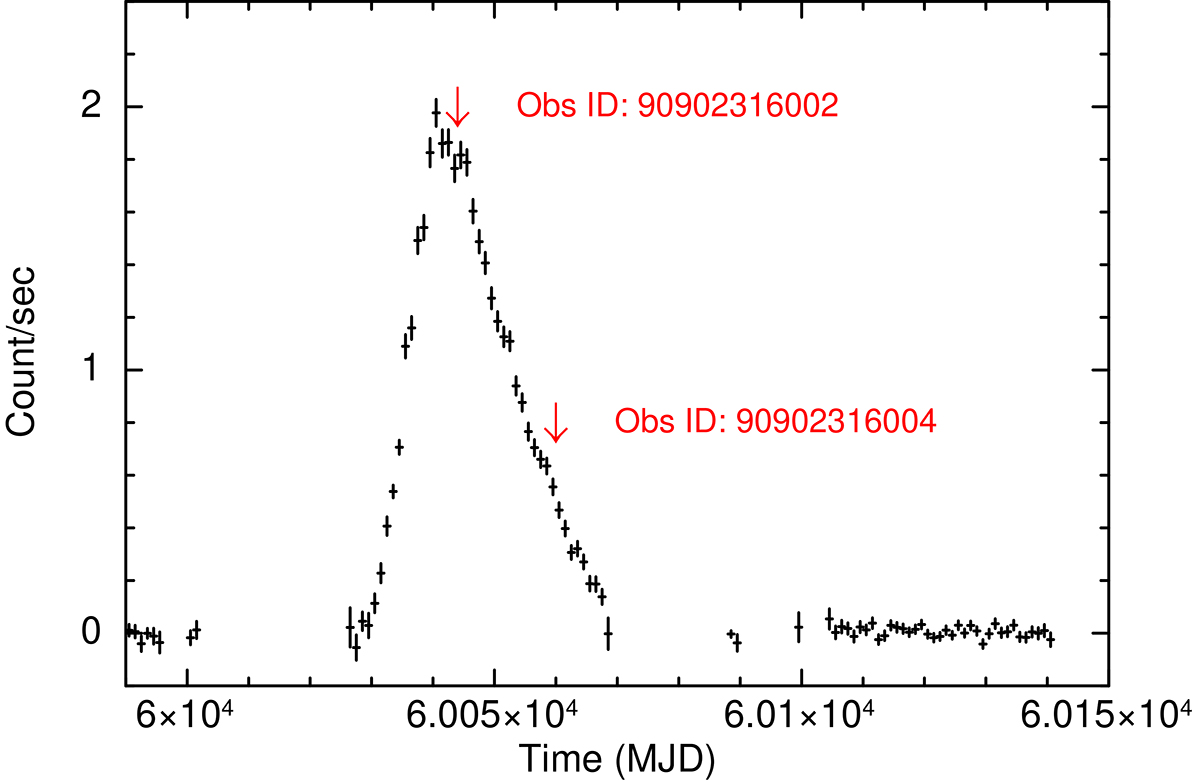
Fig. 1.
Download original image
2023 outburst of 4U 0115+63 as seen by MAXI/GSC. In black is the 2–20 keV MAXI/GSC count rate of the source binned to one day intervals. The two red arrows point to the two NuSTAR observations of the source analyzed in this work.
Current usage metrics show cumulative count of Article Views (full-text article views including HTML views, PDF and ePub downloads, according to the available data) and Abstracts Views on Vision4Press platform.
Data correspond to usage on the plateform after 2015. The current usage metrics is available 48-96 hours after online publication and is updated daily on week days.
Initial download of the metrics may take a while.