Open Access
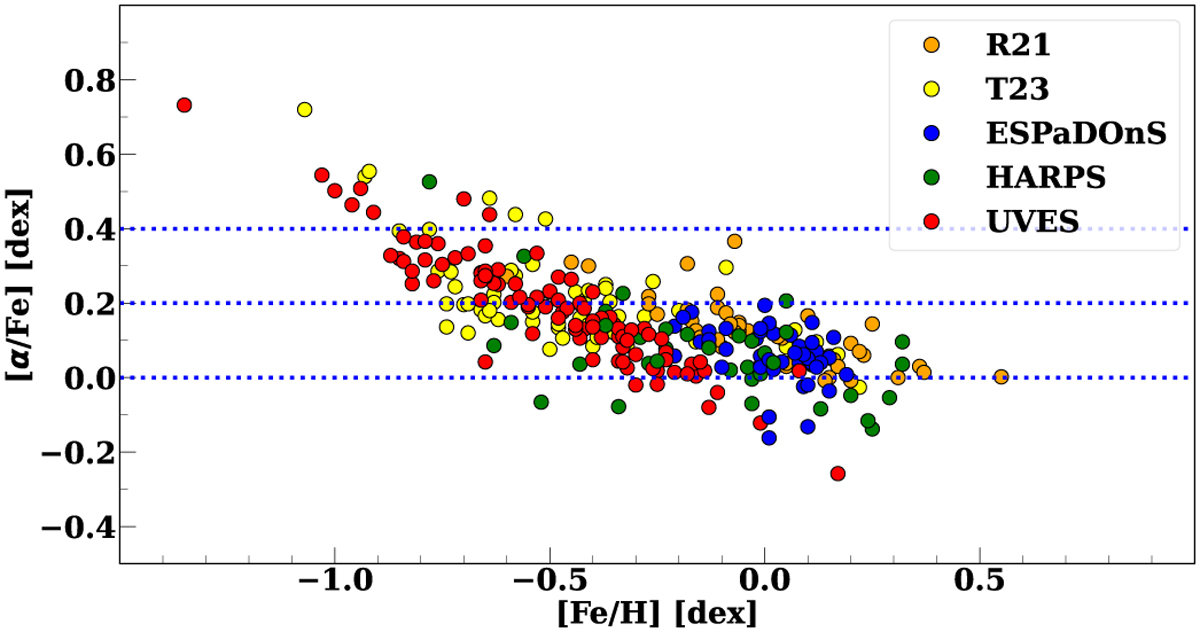
Fig. 6
Download original image
α-elements abundance in the form of [α/Fe] plotted against the iron content. The colour pattern, the same as in Fig. 5, is described in the upper right legend. The horizontal dotted blue lines highlight [α/Fe] abundances at 0.4, 0.2, and 0 dex. Typical errors for the abundances are around 0.15 dex.
Current usage metrics show cumulative count of Article Views (full-text article views including HTML views, PDF and ePub downloads, according to the available data) and Abstracts Views on Vision4Press platform.
Data correspond to usage on the plateform after 2015. The current usage metrics is available 48-96 hours after online publication and is updated daily on week days.
Initial download of the metrics may take a while.