Fig. A.2
Download original image
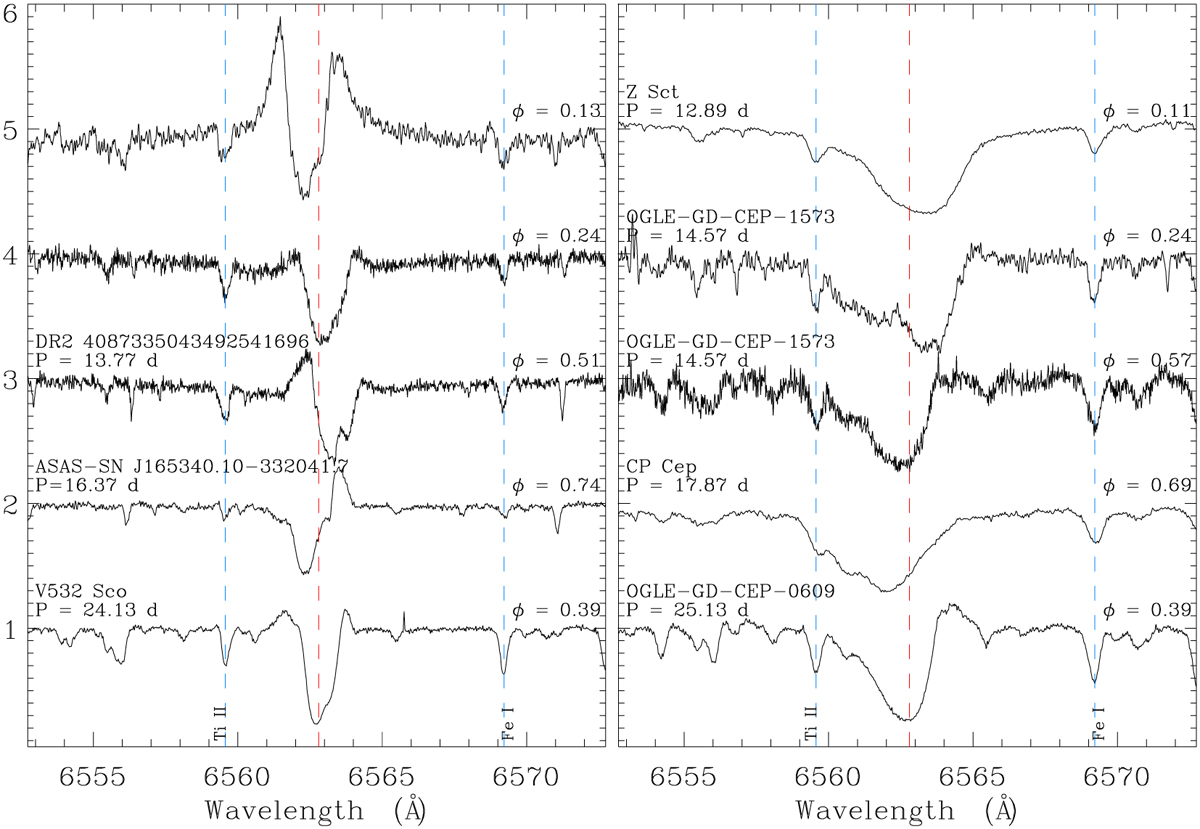
Left panel- Hα profiles for the three stars with uncertain classification. Profiles are plotted in the rest frame of the stellar atmosphere as measured from the metal lines. Phases at which the spectra were observed are reported in the plot. Right panel- Hα profiles for classical cepheids extracted from our sample, with similar periods and phases.
Current usage metrics show cumulative count of Article Views (full-text article views including HTML views, PDF and ePub downloads, according to the available data) and Abstracts Views on Vision4Press platform.
Data correspond to usage on the plateform after 2015. The current usage metrics is available 48-96 hours after online publication and is updated daily on week days.
Initial download of the metrics may take a while.