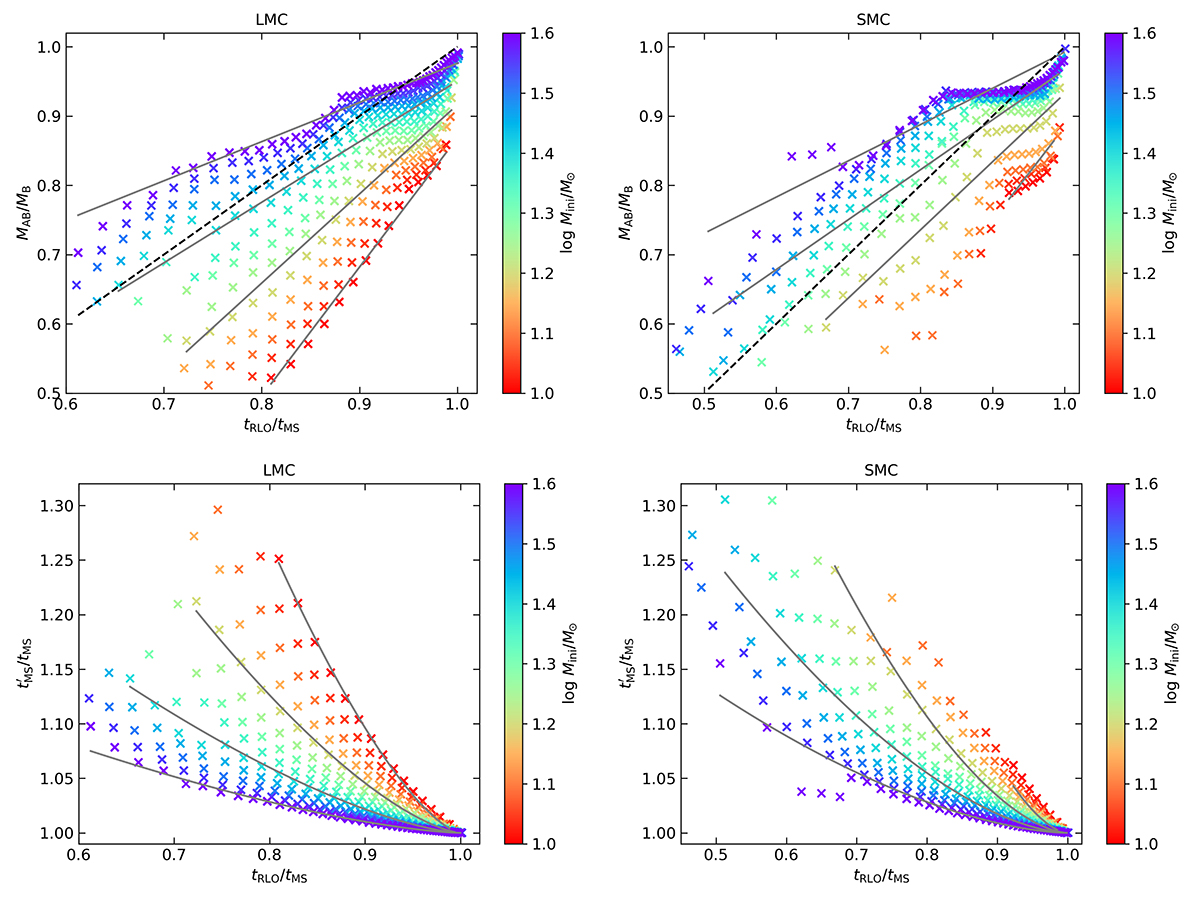
Fig. A.1.
Download original image
Same as Fig. 1 (top, also top here) and 3 (top, here bottom), but as a function of the fraction in the donor core hydrogen-burning lifetime when the RLO begins. Grey lines indicate our best fit to the data and the dashed black line shows the approach of Romero-Shaw et al. (2023), i.e. MAB = MBtRLO/tMS. The panels on the left show LMC models, and on the right SMC show models.
Current usage metrics show cumulative count of Article Views (full-text article views including HTML views, PDF and ePub downloads, according to the available data) and Abstracts Views on Vision4Press platform.
Data correspond to usage on the plateform after 2015. The current usage metrics is available 48-96 hours after online publication and is updated daily on week days.
Initial download of the metrics may take a while.