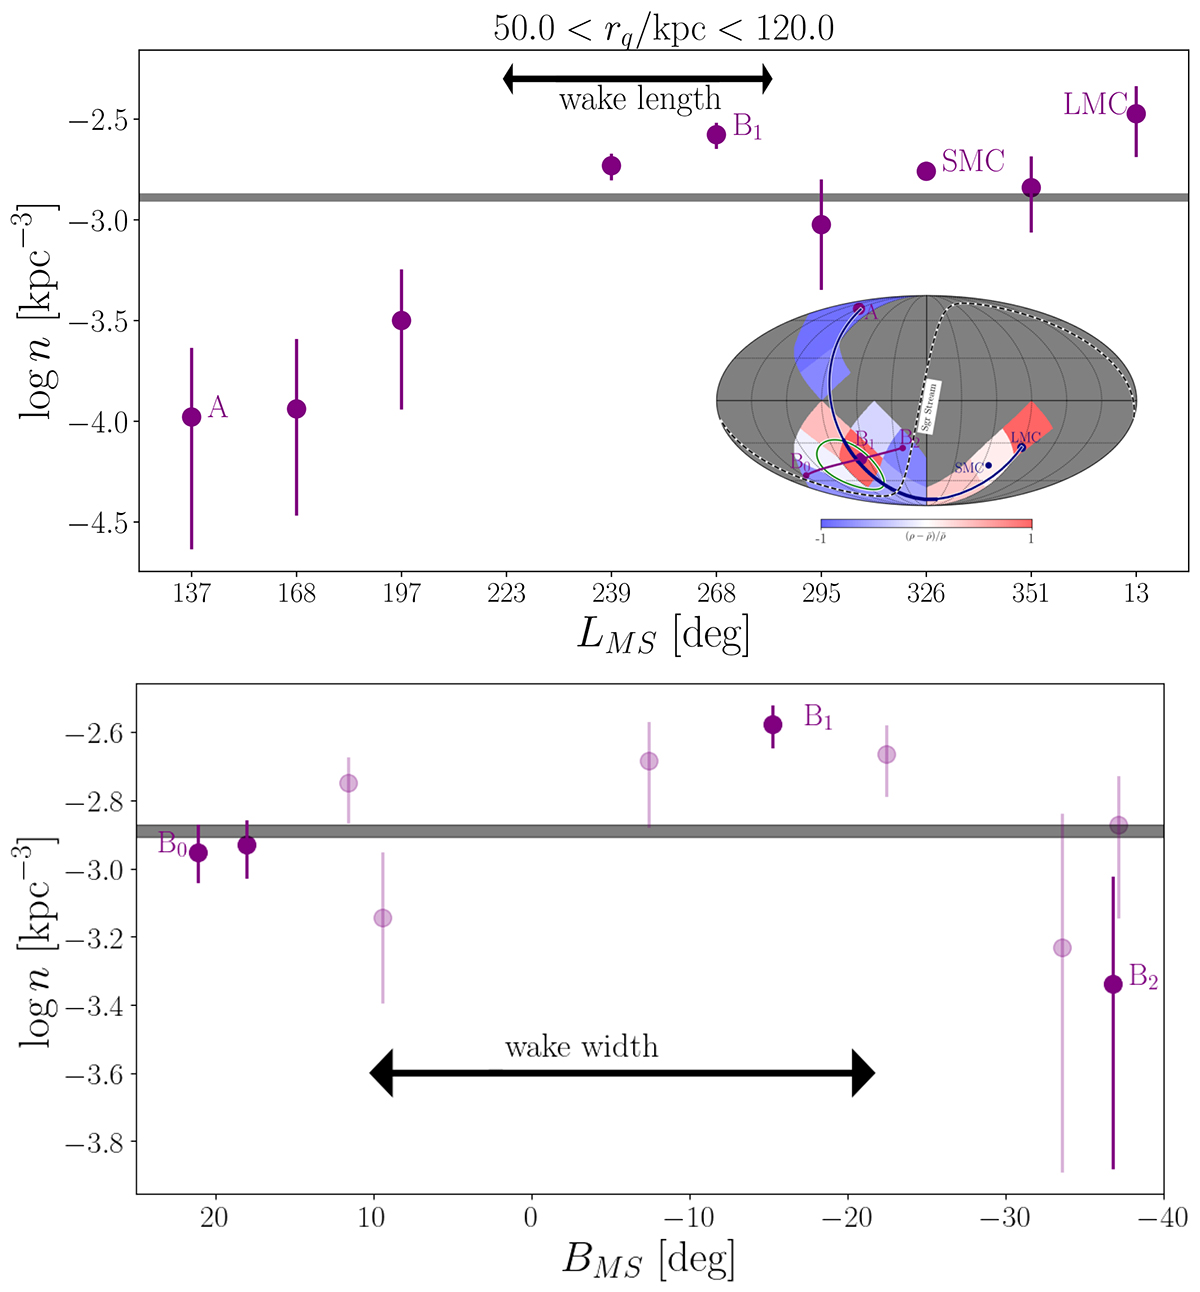
Fig. 9.
Download original image
BHB star density of the sky patches crossed by the LMC’s past orbit (Vasiliev 2023) as a function of the (LMS, BMS) coordinates (Nidever et al. 2008). Each patch has an equal projected area of 859.44 deg2 (healpy using nside = 2) and the density is calculated within 50 < r/kpc < 120. The 16th–84th percentiles of the average BHB density within this distance is shown by the shaded green line. Top panel: the density profile along LMC’s orbit from point A to the pixel containing LMC. At B1, the pixel dominated by Pisces overdensity shows a clear signature of the overdensity in contrast to regions further away from it at LMS < 230°. Bottom panel: the density profile as a function of BMS from point B0 to B1. At these large distances, and due to the steepness of the profile, the average density is dominated by the regions with the overdensities as illustrated in both panels. The lighter purple points correspond to the density at smaller patches (healpy using nside = 4) across the LMC’s orbit.
Current usage metrics show cumulative count of Article Views (full-text article views including HTML views, PDF and ePub downloads, according to the available data) and Abstracts Views on Vision4Press platform.
Data correspond to usage on the plateform after 2015. The current usage metrics is available 48-96 hours after online publication and is updated daily on week days.
Initial download of the metrics may take a while.