Fig. 7.
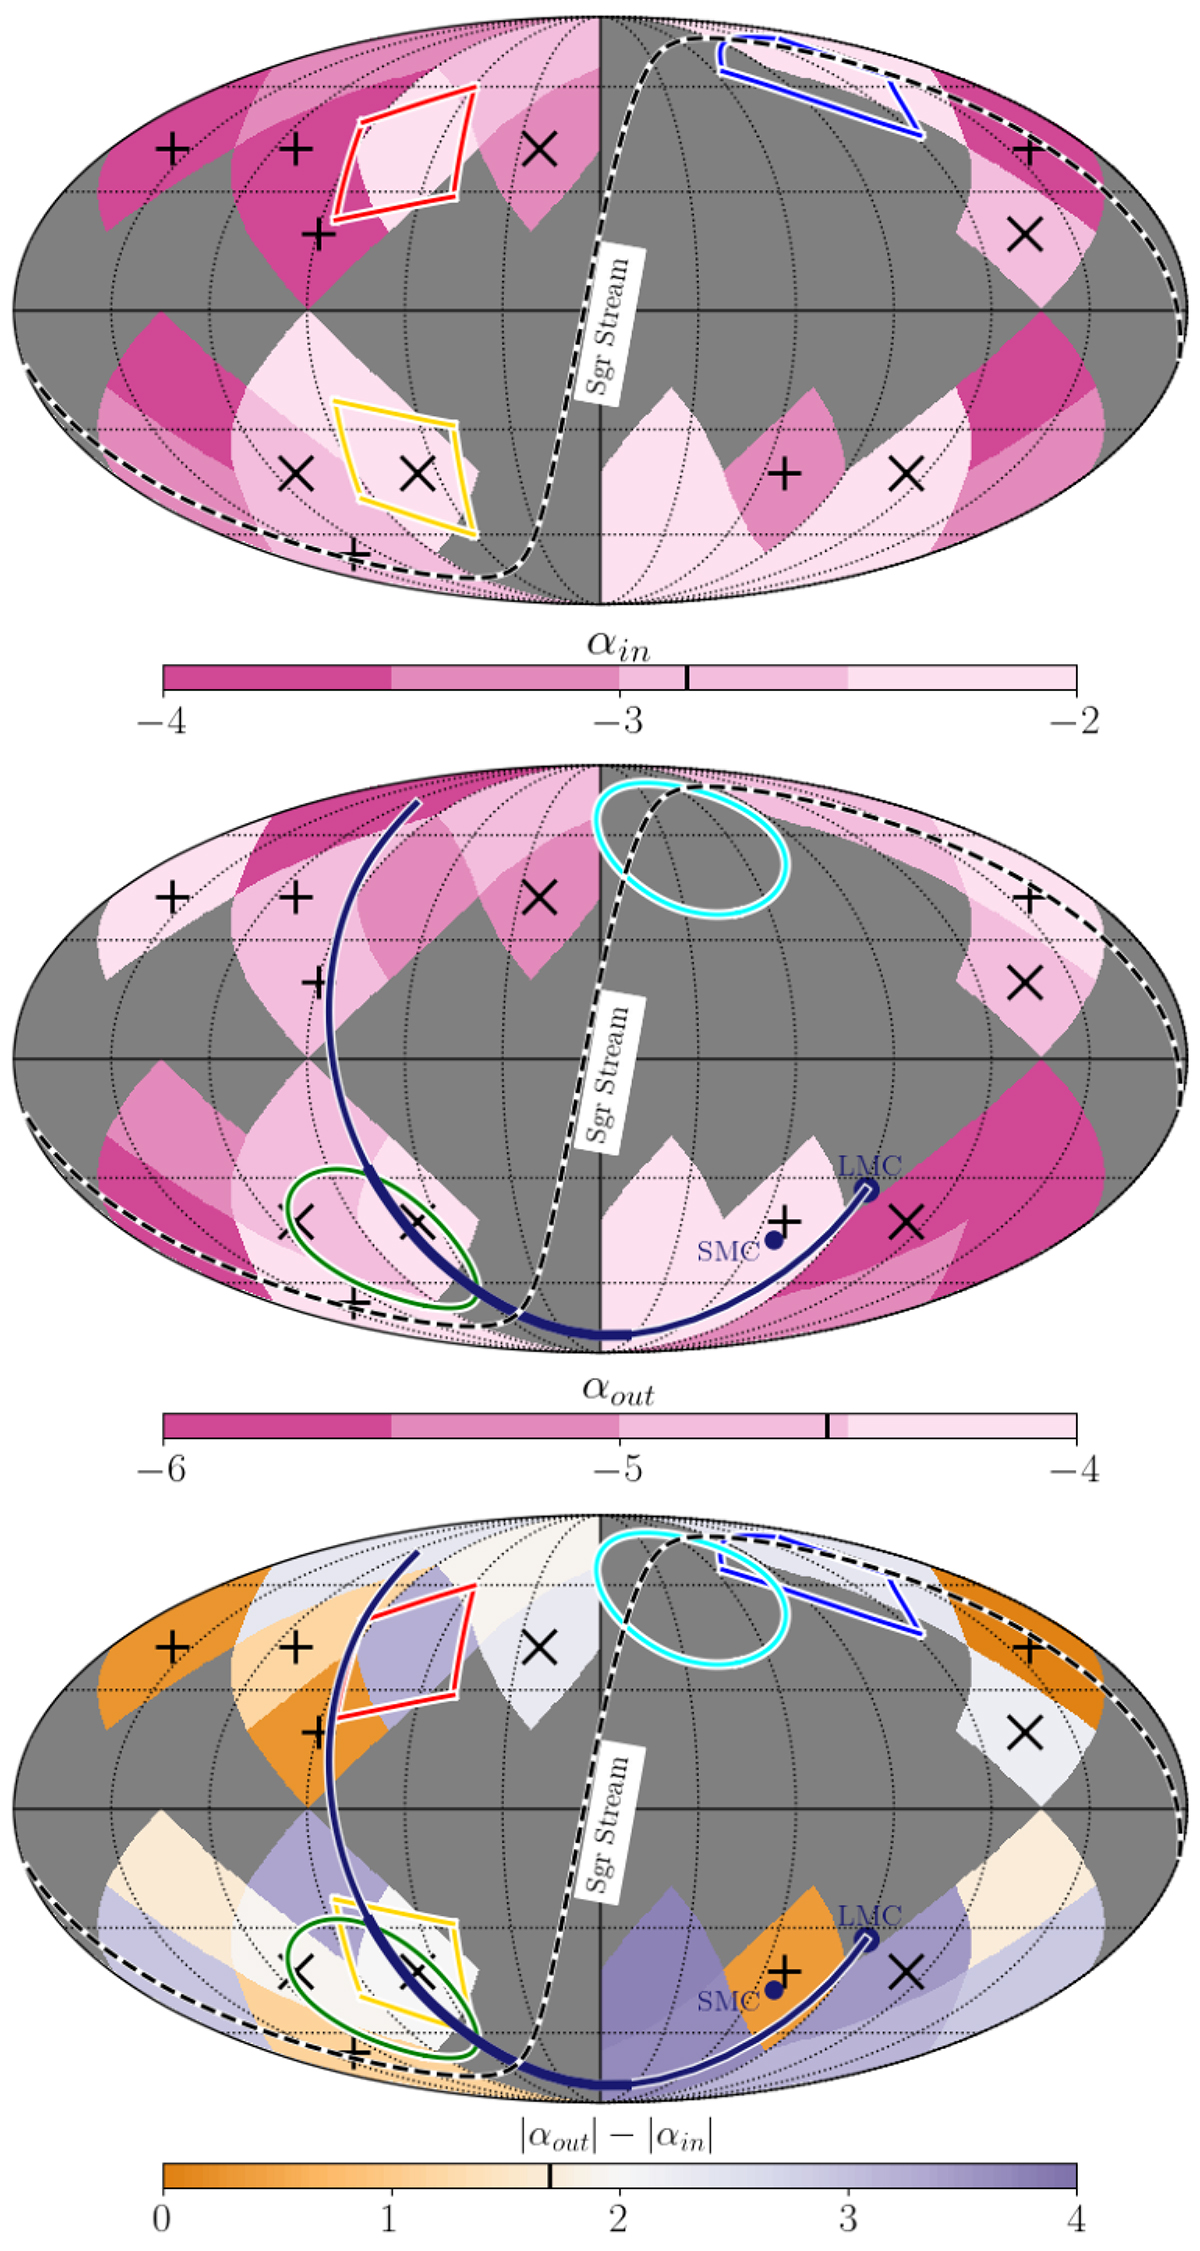
Download original image
Mollweide projection of the Galactocentric coordinates (Φgc, Θgc). The projection is divided into a grid of 48 pixels (nside = 2) with equal area. The blue, red, yellow, and orange regions delineate the regions associated with VOD, HAC-N, HAC-S, and Pisces at their typical distances. Top panel: the inner slope, αin, measured at rq = 15 kpc, of the two power law model. Middle panel: the outer slope, αout, measured at rq = 50 kpc, of the two power law model. Bottom panel: the difference between αin and αout. These panels highlight the anisotropy of the MW stellar halo profile, where several patches of the sky have distinct slopes compared to the average halo. We only show patches with more than four density points in the radial binning. The crosses and “x” indicate the regions with |αout|−|αin|< 1.5, and |αout|−|αin|> 1.5 with error in the break radius greater than 25%, respectively.
Current usage metrics show cumulative count of Article Views (full-text article views including HTML views, PDF and ePub downloads, according to the available data) and Abstracts Views on Vision4Press platform.
Data correspond to usage on the plateform after 2015. The current usage metrics is available 48-96 hours after online publication and is updated daily on week days.
Initial download of the metrics may take a while.