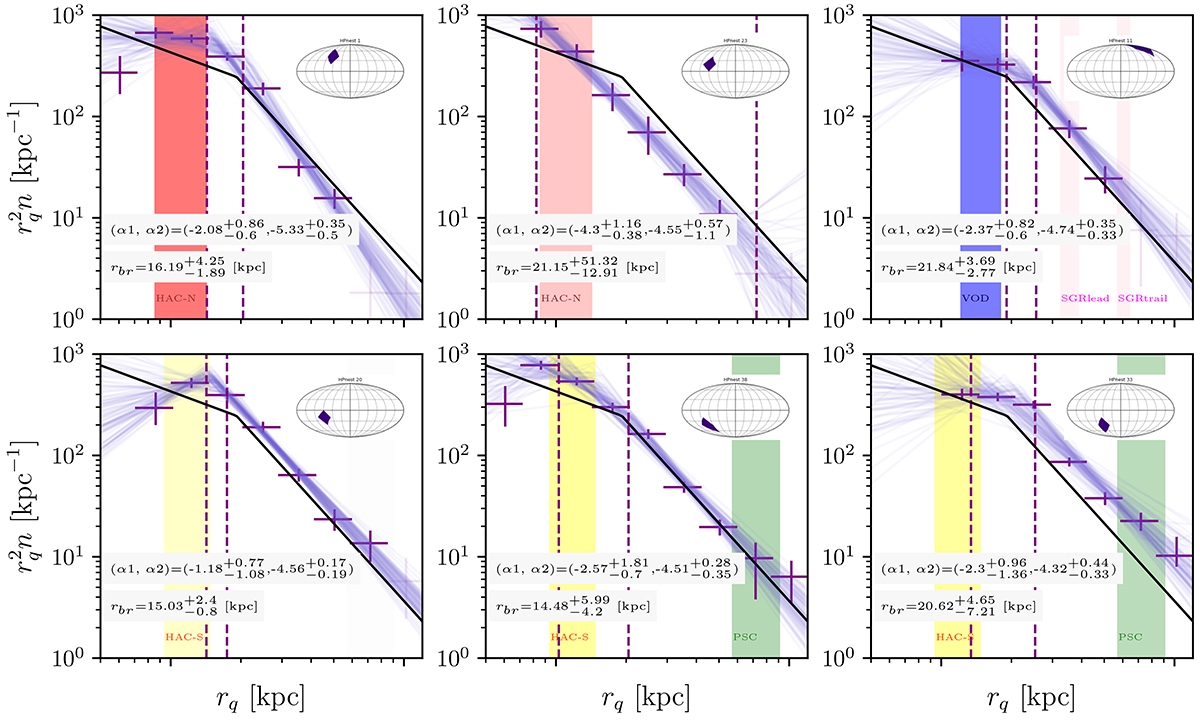
Fig. 6.
Download original image
Radial density profile for several patches in the Galactocentric sky covering an area of 859.44 deg2. The purple crosses correspond to the radial densities of the highlighted region shown in the Mollweide map of each panel. The purple solid lines correspond to the double power law fit using 100 samples drawn from the parameters’ posterior distribution, and the dashed vertical lines correspond to the 16th and 84th percentiles of the rbr posterior distribution. The black solid line is the best fit performed on the whole LSDR9 footprint. Each panel also shows the contribution of known substructures in a given region: HAC-N (red), VOD (blue), HAC-S (yellow), Pisces (green), and Sgr stream (pink). The darker the highlighted region is, the stronger the contribution of the substructure on the highlighted Galactocentric region.
Current usage metrics show cumulative count of Article Views (full-text article views including HTML views, PDF and ePub downloads, according to the available data) and Abstracts Views on Vision4Press platform.
Data correspond to usage on the plateform after 2015. The current usage metrics is available 48-96 hours after online publication and is updated daily on week days.
Initial download of the metrics may take a while.