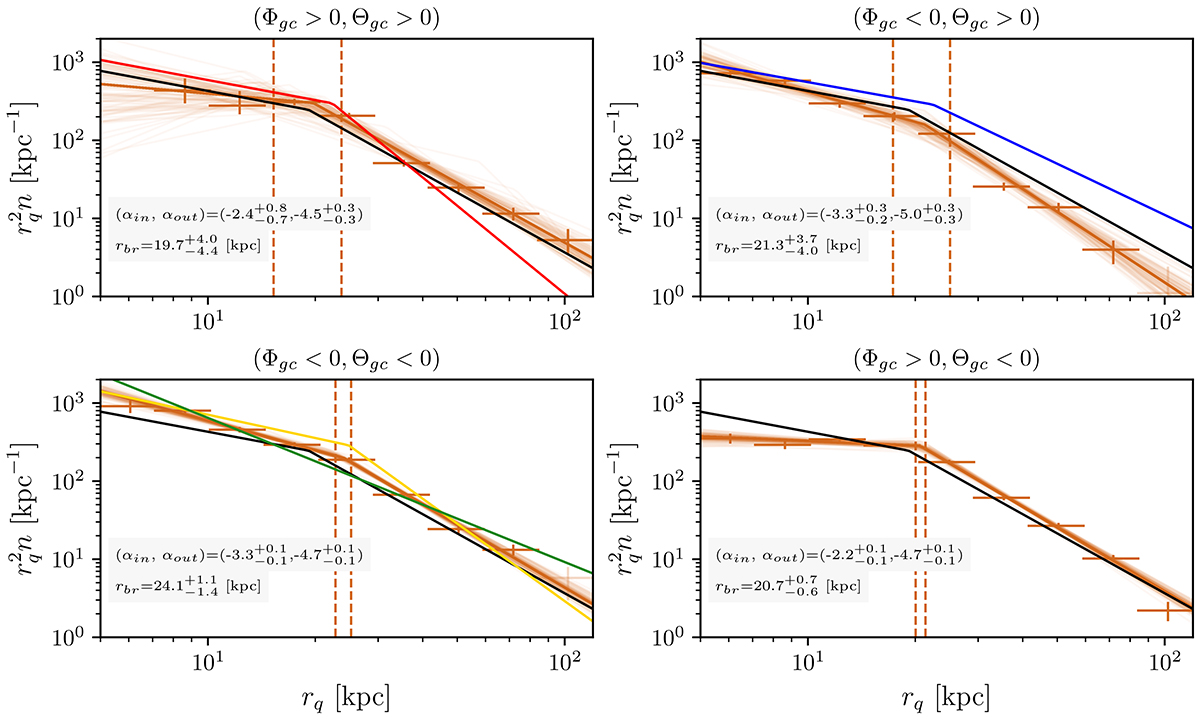
Fig. 5.
Download original image
Galactocentric radial density profiles for the four quadrants of the Galactocentric projected sky. The crosses correspond to ten radial bins equally spaced in logarithm within 5 < rq/kpc < 120. We also show the resulting fit for 100 samples drawn from the posterior distribution as the brown solid lines. The histogram corresponds to the posterior distribution of the break radius, rbr, and the dashed vertical lines are the corresponding 16th and 84th percentiles. The density profile of the full LSDR9 footprint, HAC-N, HAC-S, VOD, and Pisces are shown as the black, red, yellow, blue, and green lines, respectively.
Current usage metrics show cumulative count of Article Views (full-text article views including HTML views, PDF and ePub downloads, according to the available data) and Abstracts Views on Vision4Press platform.
Data correspond to usage on the plateform after 2015. The current usage metrics is available 48-96 hours after online publication and is updated daily on week days.
Initial download of the metrics may take a while.