Fig. 2.
Download original image
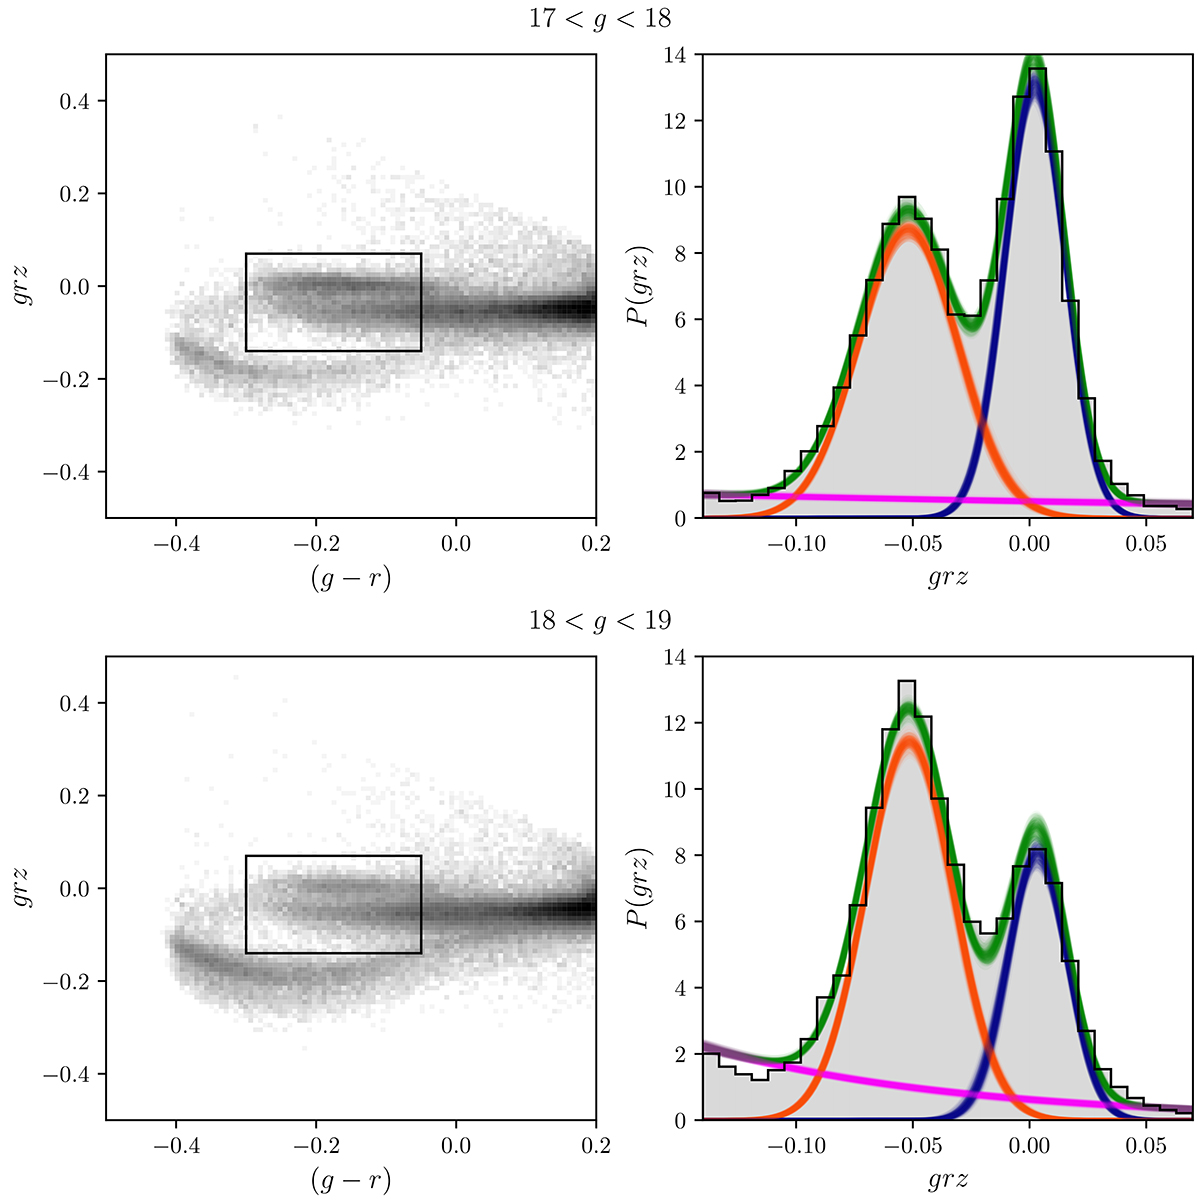
grz-colour distribution. The left panels show grz colour, see Equation (1), as a function (g − r) at different g ranges. The right panels show the P(grz), in grey, of the stars within the selection box on the left panel. The corresponding fit to the data following Equation (3) as well as the BHB, BS and background component are represented in green, blue, orange and magenta, respectively. These two examples are part of the exercise illustrated in the left column of Figure 3 which assumes flat priors for the free parameters. Throughout this paper, we do use Gaussian priors for the BHB stellar component when calculating the BHB stellar densities, see Section 3.1 for details.
Current usage metrics show cumulative count of Article Views (full-text article views including HTML views, PDF and ePub downloads, according to the available data) and Abstracts Views on Vision4Press platform.
Data correspond to usage on the plateform after 2015. The current usage metrics is available 48-96 hours after online publication and is updated daily on week days.
Initial download of the metrics may take a while.