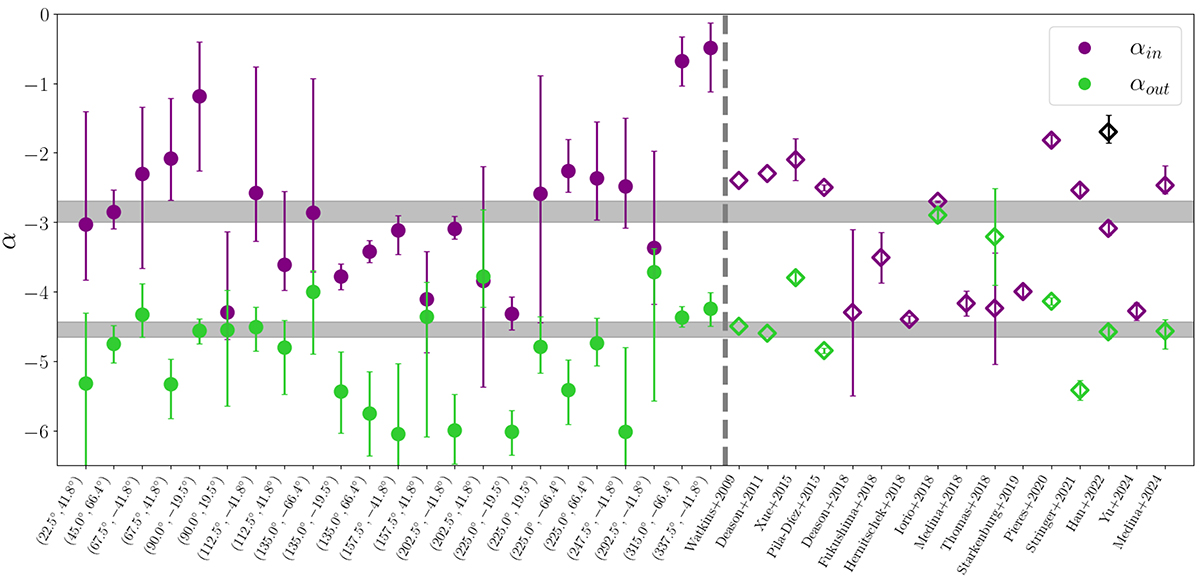
Fig. B.2.
Download original image
Inner (outer) slopes of the broken power law model fit of the density profiles shown in Figure B.1 shown as purple (green) circles. The x-axis shows the coordinates in degrees of the centre of the Galactocentric patch using healpy Python package with HEALPIX pixelisation nside = 2. The shaded region corresponds to the slopes measured for the average radial density profile as in Section 4.1. We also included the list compiled by Yu et al. (2024) of several works studying the halo radial density profile: Watkins et al. (2009), Deason et al. (2011), Xue et al. (2015), Pila-Díez et al. (2015), Deason et al. (2018), Fukushima et al. (2018), Hernitschek et al. (2018), Iorio et al. (2018), Medina et al. (2018), Thomas et al. (2018), Starkenburg et al. (2019), Pieres et al. (2020), Stringer et al. (2021), Han et al. (2022), Yu et al. (2024), Medina et al. (2024). These are shown as open diamonds. Han et al. (2022) favours a three-power-law model and thus the extra slope is shown as the black diamond. The dashed vertical line separates data from our work from literature values.
Current usage metrics show cumulative count of Article Views (full-text article views including HTML views, PDF and ePub downloads, according to the available data) and Abstracts Views on Vision4Press platform.
Data correspond to usage on the plateform after 2015. The current usage metrics is available 48-96 hours after online publication and is updated daily on week days.
Initial download of the metrics may take a while.