Fig. A.1.
Download original image
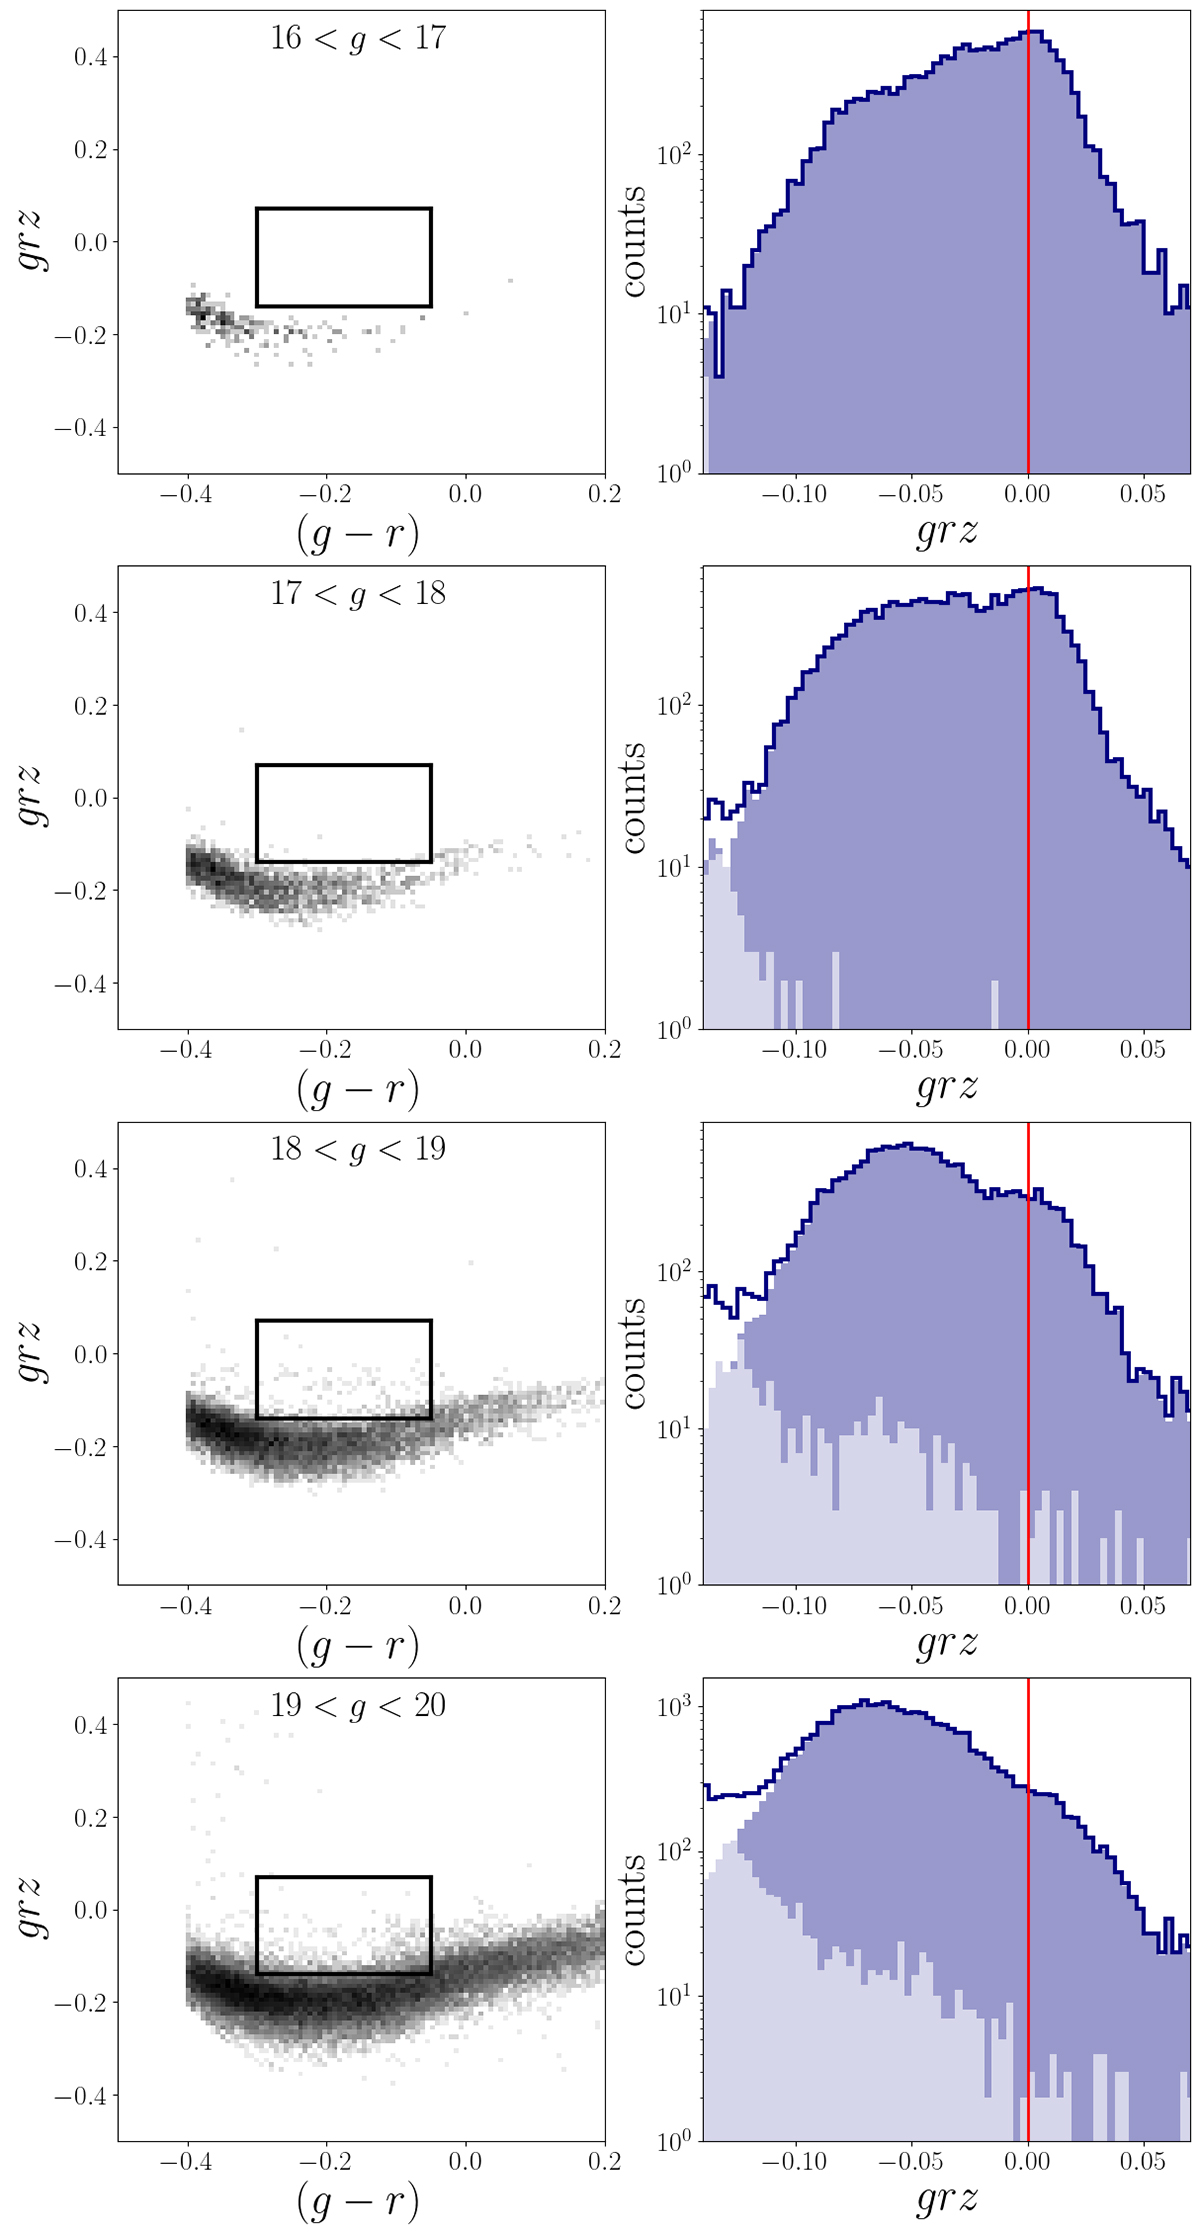
Left column: The grz − (g − r) plane for the white dwarf stars in from the Gaia EDR3 catalogue (Gentile Fusillo et al. 2021). The black rectangle shows the region of interest in our study. Right column: The grz histogram for objects inside the black rectangle. The white dwarf and non-white dwarf objects histograms are shown as the light and dark blue histograms, respectively. The solid blue line corresponds to their sum. The solid red line marks grz = 0, the centre of the BHB distribution.
Current usage metrics show cumulative count of Article Views (full-text article views including HTML views, PDF and ePub downloads, according to the available data) and Abstracts Views on Vision4Press platform.
Data correspond to usage on the plateform after 2015. The current usage metrics is available 48-96 hours after online publication and is updated daily on week days.
Initial download of the metrics may take a while.