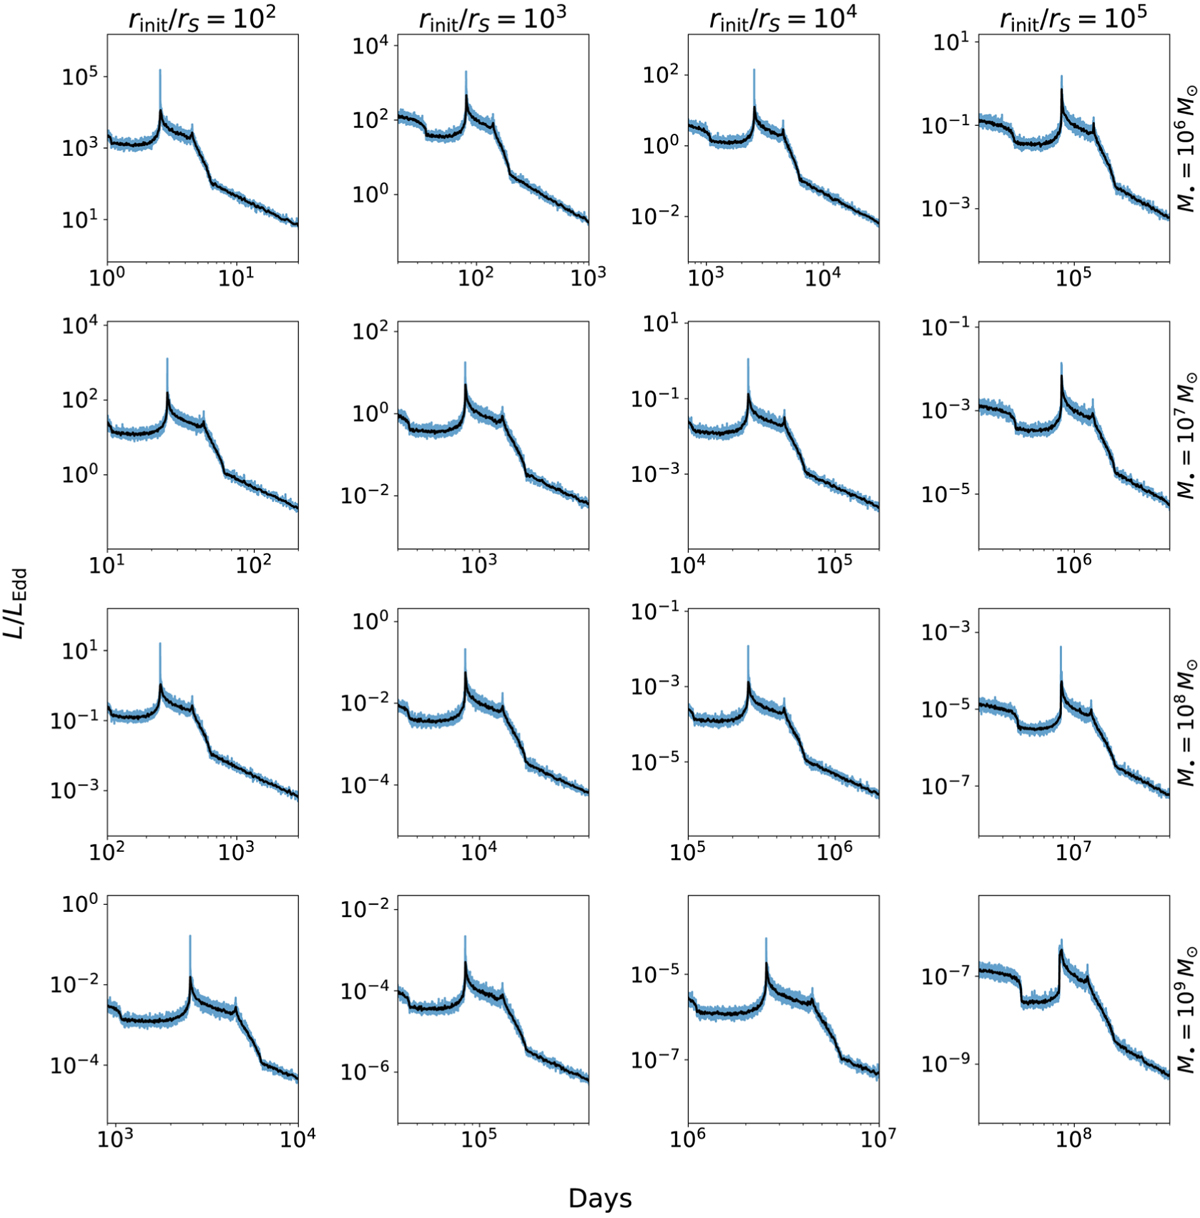
Fig. A.1
Download original image
Example light curves from stellar collision debris accreting onto a BH. Along the horizontal axis, we vary the distance of the collision from the black hole, normalized by the Schwarzschild radius, rinit/rS. Along the vertical axis, we vary the mass of the supermassive black hole, M•. The y–axis of every plot is normalized by the Eddington luminosity for the black hole, LEdd. For all light curves shown here, the orientation is that shown by the yellow relative velocity vector in Fig. 2.
Current usage metrics show cumulative count of Article Views (full-text article views including HTML views, PDF and ePub downloads, according to the available data) and Abstracts Views on Vision4Press platform.
Data correspond to usage on the plateform after 2015. The current usage metrics is available 48-96 hours after online publication and is updated daily on week days.
Initial download of the metrics may take a while.