Fig. 2
Download original image
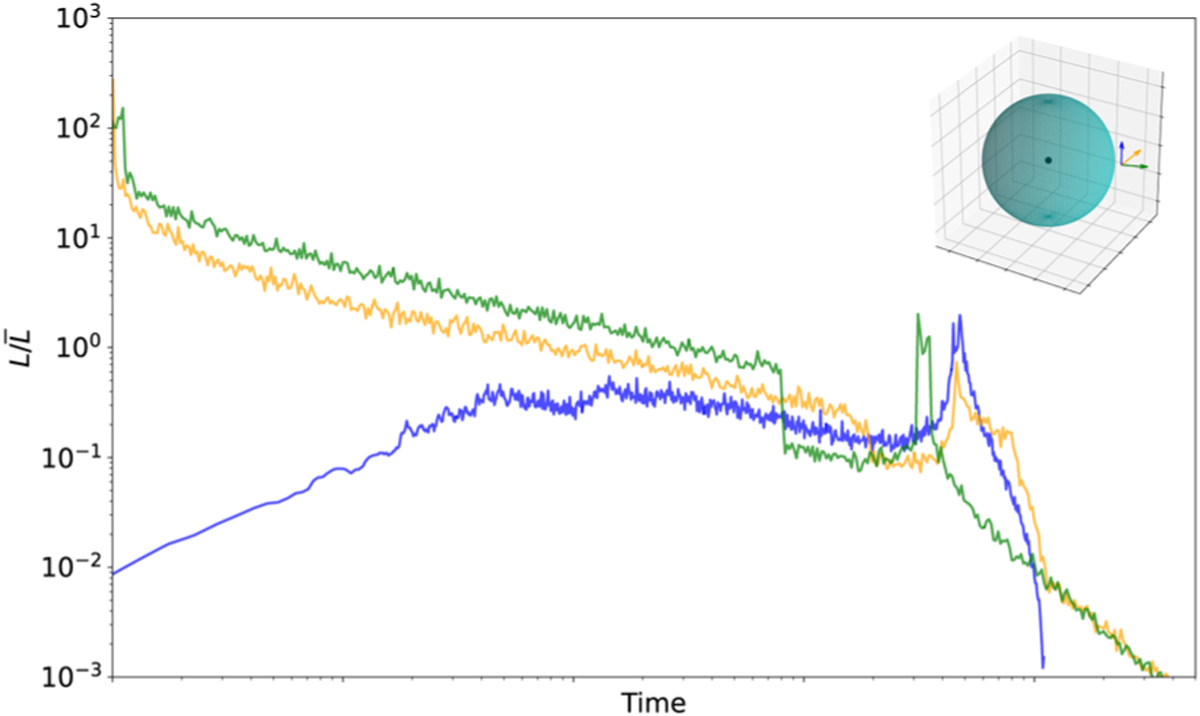
Three different simulated collision events with the relative velocity vectors pointed in three different directions, as shown in the upper right hand corner of the plot. On the y-axis we plot the luminosity L divided by the average luminosity over the duration of the light curve ![]() , and on the x-axis we plot time. We intentionally exclude units on the x-axis because the timescales over which the accretion events occur can vary widely, as shown in Fig. A.1. We see that while the overall magnitude of the event is not significantly affected by the relative velocity vector orientation, the shape of the light curve, including peaks, rises, and falls, is affected.
, and on the x-axis we plot time. We intentionally exclude units on the x-axis because the timescales over which the accretion events occur can vary widely, as shown in Fig. A.1. We see that while the overall magnitude of the event is not significantly affected by the relative velocity vector orientation, the shape of the light curve, including peaks, rises, and falls, is affected.
Current usage metrics show cumulative count of Article Views (full-text article views including HTML views, PDF and ePub downloads, according to the available data) and Abstracts Views on Vision4Press platform.
Data correspond to usage on the plateform after 2015. The current usage metrics is available 48-96 hours after online publication and is updated daily on week days.
Initial download of the metrics may take a while.