Fig. 6.
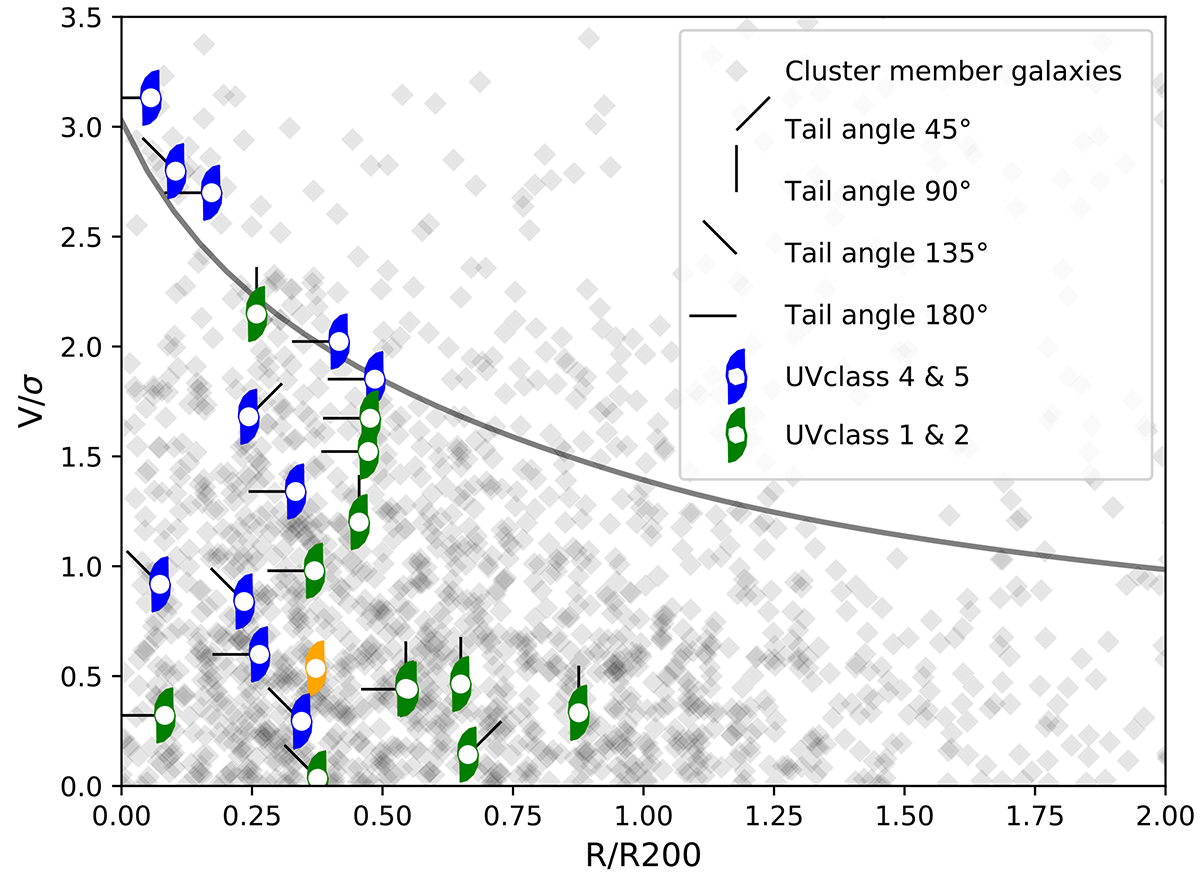
Download original image
Phase-space diagram for member galaxies in our six program clusters (grey diamonds). We assign different-coloured spiral-shaped points for the UV class of the jellyfish galaxy candidates from our analysis of UVIT imaging. We assign the UV class as two groups in the colour scheme here to examine the collective behaviour in the plot. The tail angle of these galaxies is divided into four groups of 45° each and each group is assigned a line of orientation that changes progressively with the group. Note that we plot the normalised, projected distance from the cluster centre (in units of R200) against the galaxy line-of-sight velocities with respect to the cluster mean, also normalised to cluster velocity dispersion. The three-dimensional (unprojected) escape velocity in an NFW halo with a concentration of c = 6 is shown by the grey curve. Galaxy JW108 from the A3376 cluster, which has a very pronounced truncation of star formation within its disc, is shown in orange.
Current usage metrics show cumulative count of Article Views (full-text article views including HTML views, PDF and ePub downloads, according to the available data) and Abstracts Views on Vision4Press platform.
Data correspond to usage on the plateform after 2015. The current usage metrics is available 48-96 hours after online publication and is updated daily on week days.
Initial download of the metrics may take a while.